Paloma Valley High School
Rating
Not Available
Not Available

3 out of 5 | 8 Reviews
Find Old Friends From Paloma Valley High School
Use the form below to search for alumni from Paloma Valley High School.
School Description
School Summary and Highlights
- Enrolls 2,717 high school students from grades 9-12
- Ranks 241st out of 1,197 high schools in CA.
- 2010 Overall School AYP Met Status: No
Additional Contact Information
- Mailing Address: 31375 Bradley Rd., Menifee, CA 92584
School District Details
- Perris Union High School District
- Per-Pupil Spending: $8,396
- Graduation Rate: 95.8%
- Dropout Rate: 4.1%
- Students Per Teacher: 24.3
- Enrolled Students: 10,416
Faculty Details and Student Enrollment
Students and Faculty
- Total Students Enrolled: 2,717
- Total Full Time "Equivalent" Teachers: 101.8
- Average Student-To-Teacher Ratio: 26.7
Students Gender Breakdown
- Males: 1,387 (51.0%)
- Females: 1,330 (49.0%)
Free Lunch Student Eligibility Breakdown
- Eligible for Reduced Lunch: 164 (6.0%)
- Eligible for Free Lunch: 612 (22.5%)
- Eligible for Either Reduced or Free Lunch: 776 (28.6%)
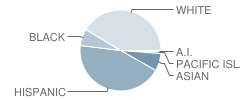
Student Enrollment Distribution by Race / Ethnicity
| Number | Percent | |
|---|---|---|
| American Indian | 22 | 0.8% |
| Black | 186 | 6.8% |
| Asian | 193 | 7.1% |
| Hispanic | 1,174 | 43.2% |
| White | 1,110 | 40.9% |
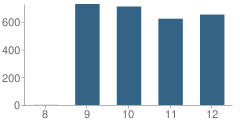
Number of Students Per Grade
| Number | Percent | |
|---|---|---|
| 8th Grade | 1 | 0.04% |
| 9th Grade | 729 | 26.8% |
| 10th Grade | 711 | 26.2% |
| 11th Grade | 623 | 22.9% |
| 12th Grade | 653 | 24.0% |
Graduates Information (2010)
Graduation Rate
School:
87.3%
District:
74.4%
State:
78.6%
Teacher Education Background (2009)
Percent With Master's Degree
School:
31.2%
District:
24.0%
Percent With Bachelor's Degree
School:
12.0%
District:
4.0%
Percent With Ph.D.
School:
2.4%
District:
4.0%
Teacher Credentials & Experience (2009)
Average Age
School:
43.4
District:
49.8
Average Number of Years of Teacher Experience: 14.5
Number of Certificated Staff: 125.0
Percent of Teachers With Credentials: 96.5%
Percent of Teachers With Emergency Credentials: 0.9%
Source: CA Department of Education, Source: NCES 2009-2010
School Ratings and Reviews
Overall Rating: 3

3 out of 5 | 8 Reviews
The Overall Rating is the school's average rating from parents, students, school faculty and staff. The highest rating is five apples and the lowest is one apple.
Share Your Review About This School
8 reviews for Paloma Valley High School
- Reviewed by Former Student on July 13, 2010
- Rating:
 (3 / 5) Flag as inappropriate
 - I am a 2006 grad from Paloma. I would give this place a 3.It was an "okay" school.Unless you were in sports. Sports as usually seemed to rule everything. My teachers ranged from excellent to a horrible senior year English teacher that just seemed to have it out for most students. There were alot of VERY talented musicians as well. Thats what I remember the most there were the musicians. For the most part I had fun but I agree that there was not too much emphasis on higher education.
- Reviewed by Student on January 27, 2010
- Rating:
 (5 / 5) Flag as inappropriate
 - Paloma is a great school with an amazing baseball program. The coaches and staff have every right to do anything they have to to keep the fields nice. If this means closing the field to the public then so be it!
- Reviewed by Former Student on December 31, 2009
- Rating:
 (1 / 5) Flag as inappropriate
 - Paloma is just another waste of tax dollars. If you want your children to have access to day care you don't want to pay for that will turn them into more useless subhumans then by all means send them here. Oh, and when the precious statistics of certain racists make the neighborhood too unsafe for you, feel free to whiteflight to the next town.
- Reviewed by Former Student on June 10, 2009
- Rating:
 (2 / 5) Flag as inappropriate
 - I am a 1999 graduate of Paloma Valley the first 4 year attendees to graduate. As the time the teachers I had varied from an amazing positive influence to a teacher who yelled and used foul language towards the students. I made a complaint and was called out in front of my classmates and cursed at again. I had numerous teachers make racist comments or down someones ability to accomplish goals. I did have 2 really great teachers who encouraged me to follow my goals and believe I can do anything. For those two teachers and those alone is why I actually gave the school a 2 rating. The whole district has a lot they can improve on.
- Reviewed by Former Student on April 03, 2009
- Rating: (2 / 5) Flag as inappropriate
- I graduated here in 2003. In addition, I was an AP student and could say this school, and the Menifee area could improve a lot. A lot of faculty made ignorant statements, and there were several incidents of racism. There was not a heavy emphasis on what we as students could achieve, which is why a lot of my peers never went on to higher levels of learning. Furthermore, friends of mine that went on to prestigious schools such as Berkeley and Stanford went there because of their own motivation, not because of any asset the school provided. Menifee and PVHS have a long way to go socially, culturally, and educationally.
- Reviewed by Parent/Guardian on August 06, 2008
- Rating: (5 / 5) Flag as inappropriate
- I have three sons. 2 of which have already graduated from Paloma High School and 1 son who will be a senior this year. I have had nothing but the best regard for all the teaching staff as well as the Baseball & Football coaches. My boys have had great roles models at Paloma and I would recommend this school to all my friends and family. Bye the way, my Paloma Graduate Sons, are now College Graduates!
- Reviewed by Teacher on September 12, 2007
- Rating: (5 / 5) Flag as inappropriate
- I was prompted to write this review in response to the parent that was apparently asked to leave the baseball field. It would seem unfair to rate an entire school on ones inability to use its facilities without permission.
Paloma is a good school with several areas where it could improve. We are not A+ yet, but far beyond the F grade given by one individual.
- Reviewed by Parent/Guardian on February 24, 2007
- Rating: (1 / 5) Flag as inappropriate
- It is a sad thought that no longer can a teenager play baseball on a high school baseball field. I was told to leave the Varsity baseball field today by the baseball coach. He had every right to tell us to leave. But at the same time there is no where else to go in this area to play baseball on a real field. Rules are rules and they are made to stop the abusers. The Menifee area really needs a quality area for teenagers to play baseball. The Jr Varsity field is one of the worst fields I have ever seen. My son played there a few years ago and it was bad then and very bad now. The outfield is a hazard to anyone playing it. Any grounder has the possibility of hitting you in the face it is so lumpy. That is the reason for my sons and I using the Varsity field on the week ends. I have seen a number of different people use that field on the weekends. Most of whom are those that play on the Varsity teem or have played for the Varsity teem. I have seen some take care of the field and some that don't. For the ones that don't is the reason for closing the field to all. It is sad to think when I was a kid every high school with its baseball field was open for us all to play on at any time and now in an age when you want to keep your kids doing something other than video games or getting into trouble that you cant use a high school baseball field.
Read All 8 Reviews ->
School Map and Similar Schools Nearby
Click to Activate Map of Nearby School Campuses
Private
Public
This School
Similar Schools Nearby
| Vista Murrieta High School 9-12 | 3,388 Students | 4.7 miles away | Not Yet Rated | |
| Elsinore High School 9-12 | 2,356 Students | 6.0 miles away |  3 out of 5 | |
| Heritage High School 9-12 | 2,529 Students | 6.2 miles away |  2 out of 5 | - |
| Murrieta Mesa High School 9-12 | 1,112 Students | 7.1 miles away | Not Yet Rated | - |
| Murrieta Valley High School 9-12 | 2,695 Students | 7.2 miles away |  5 out of 5 | |
| Chaparral High School 9-12 | 3,121 Students | 9.1 miles away | Not Yet Rated | |
| Temescal Canyon High School 9-12 | 2,009 Students | 9.5 miles away | Not Yet Rated | |
| Perris High School 9-12 | 2,589 Students | 9.6 miles away |  2.5 out of 5 | |
| West Valley High School 9-12 | 1,896 Students | 11.0 miles away | Not Yet Rated | |
| Lakeside High School 9-12 | 2,183 Students | 11.1 miles away | Not Yet Rated | |
Compare This School To Nearby Schools ->
School Community Forum

Join a discussion about Paloma Valley High School and talk to others in the community including students, parents, teachers, and administrators.
Popular Discussion Topics
- Admissions and Registration Questions (e.g. Dress Code and Discipline Policy)
- School Calendar and Upcoming Events (e.g. Graduation)
- After School Programs, Extracurricular Activities, and Athletics (e.g. Football)
- News and Announcements (e.g. Yearbook and Class Supply List Details)
- Graduate and Alumni Events (e.g. Organizing Class Reunions)
Navigation
Can't Find What You Are Looking For?
Rankings
Nearby Cities
Sponsored Links
K-12 Articles

National Memories
Few events are seared into our memory, and bring the country together-not as Democrat and...
Few events are seared into our memory, and bring the country together-not as Democrat and...

Information on Cyberbullying
What is Cyberbullying? Cyberbullying is a new form of harassment, emotional abuse,...
What is Cyberbullying? Cyberbullying is a new form of harassment, emotional abuse,...

Helping Your Learning Disabled Child
Thousands of children in America struggle to learn on a daily basis. Many of them have invisible...
Thousands of children in America struggle to learn on a daily basis. Many of them have invisible...