Hillview Junior High School
Rating
Not Available
Not Available

3 out of 5 | 5 Reviews
Find Old Friends From Hillview Junior High School
Use the form below to search for alumni from Hillview Junior High School.
School Description
School Summary and Highlights
- Enrolls 1,090 middle and high school students from grades 6-8
- Ranks 1601st out of 2,050 middle schools in CA.
- 2010 Overall School AYP Met Status: No
Additional Contact Information
- Mailing Address: 333 Yosemite Dr., Pittsburg, CA 94565
School Operational Details
- Title I EligibleAll students of this school are eligible for participation in authorized programs.
School District Details
- Pittsburg Unified School District
- Per-Pupil Spending: $8,754
- Graduation Rate: 65.2%
- Dropout Rate: 7.6%
- Students Per Teacher: 21.4
- Enrolled Students: 9,020
Faculty Details and Student Enrollment
Students and Faculty
- Total Students Enrolled: 1,090
- Total Full Time "Equivalent" Teachers: 45.6
- Average Student-To-Teacher Ratio: 23.9
Students Gender Breakdown
- Males: 563 (51.7%)
- Females: 527 (48.3%)
Free Lunch Student Eligibility Breakdown
- Eligible for Reduced Lunch: 197 (18.1%)
- Eligible for Free Lunch: 660 (60.6%)
- Eligible for Either Reduced or Free Lunch: 857 (78.6%)
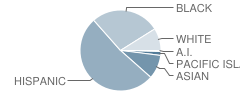
Student Enrollment Distribution by Race / Ethnicity
| Number | Percent | |
|---|---|---|
| American Indian | 6 | 0.6% |
| Black | 290 | 26.6% |
| Asian | 102 | 9.4% |
| Hispanic | 544 | 49.9% |
| White | 95 | 8.7% |
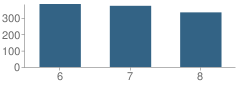
Number of Students Per Grade
| Number | Percent | |
|---|---|---|
| 6th Grade | 384 | 35.2% |
| 7th Grade | 373 | 34.2% |
| 8th Grade | 333 | 30.6% |
Teacher Education Background (2009)
Percent With Master's Degree
School:
14.3%
District:
24.0%
Percent With Bachelor's Degree: 16.3%
Teacher Credentials & Experience (2009)
Percent of Teachers With Emergency Credentials: 2.3%
Percent of Teachers With Credentials: 88.6%
Number of Certificated Staff: 49.0
Average Number of Years of Teacher Experience: 13.3
Average Age
School:
42.8
District:
51.4
Source: CA Department of Education, Source: NCES 2009-2010
School Ratings and Reviews
Overall Rating: 3

3 out of 5 | 5 Reviews
The Overall Rating is the school's average rating from parents, students, school faculty and staff. The highest rating is five apples and the lowest is one apple.
Share Your Review About This School
5 reviews for Hillview Junior High School
- Reviewed by Former Student on October 20, 2008
- Rating:
 (1 / 5) Flag as inappropriate
 - HILLVIEW SUCKS!!! ALL BOUT CENTRAL!!!!! WOOT WOOT
- Reviewed by Teacher on September 26, 2007
- Rating: (1 / 5) Flag as inappropriate
- This Stinks
- Reviewed by Student on July 08, 2007
- Rating:
 (5 / 5) Flag as inappropriate
 - I loved it at Hillview the principal Mr.Whitmire was great. I will miss going to hillview
- Reviewed by Student on December 13, 2006
- Rating: (5 / 5) Flag as inappropriate
- I am a student here at Hillview and I think this school is wonderful. I think most of the staff works very hard. There are a few times were some teachers really dont do anything.
- Reviewed by Parent/Guardian on September 11, 2006
- Rating:
 (4 / 5) Flag as inappropriate
 - I think that the staff and administration are working very hard to bring the school up to an A+. They are a dedicated group who put the students needs first and guide them with a stern but fair hand. The students are treated with respect and I am glad my kids were able to go there.
School Map and Similar Schools Nearby
Click to Activate Map of Nearby School Campuses
Private
Public
This School
Similar Schools Nearby
| Pittsburg High School 9-12 | 2,391 Students | 1.1 miles away |  4 out of 5 | |
| Central Junior High School 6-8 | 1,099 Students | 1.7 miles away | Not Yet Rated | |
| Antioch High School 9-12 | 2,289 Students | 3.8 miles away | Not Yet Rated | |
| Concord High School 9-12 | 1,591 Students | 5.7 miles away | Not Yet Rated | |
| Clayton Valley High School 9-12 | 1,868 Students | 5.7 miles away | Not Yet Rated | |
| Deer Valley High School 9-12 | 2,692 Students | 6.4 miles away |  3 out of 5 | |
| Mt. Diablo High School 9-12 | 1,610 Students | 8.2 miles away |  5 out of 5 | |
| Ygnacio Valley High School 9-12 | 1,343 Students | 8.7 miles away | 5 out of 5 | |
| Heritage High School 9-12 | 2,114 Students | 9.1 miles away | Not Yet Rated | |
| Northgate High School 9-12 | 1,476 Students | 9.3 miles away | Not Yet Rated | |
Compare This School To Nearby Schools ->
School Community Forum

Join a discussion about Hillview Junior High School and talk to others in the community including students, parents, teachers, and administrators.
Popular Discussion Topics
- Admissions and Registration Questions (e.g. Dress Code and Discipline Policy)
- School Calendar and Upcoming Events (e.g. Graduation)
- After School Programs, Extracurricular Activities, and Athletics (e.g. Football)
- News and Announcements (e.g. Yearbook and Class Supply List Details)
- Graduate and Alumni Events (e.g. Organizing Class Reunions)
Navigation
Can't Find What You Are Looking For?
Rankings
Nearby Cities
Sponsored Links
K-12 Articles

What to Do when Your Student is Held Back
Kids develop at different speeds, and everyone has different skills and abilities. School is easy...
Kids develop at different speeds, and everyone has different skills and abilities. School is easy...

Is Your Child's Teacher a Bully?
We've all heard about kids being bullied by peers. Kids taunt, tease, pull hair, shove and push...
We've all heard about kids being bullied by peers. Kids taunt, tease, pull hair, shove and push...

Help Your Child Achieve Success in Middle School
Middle school is for children between the ages of 10 and 14 years. At this time children begin to...
Middle school is for children between the ages of 10 and 14 years. At this time children begin to...