Glenview Elementary School
Rating
Not Available
Not Available

No Reviews Yet
Find Old Friends From Glenview Elementary School
Use the form below to search for alumni from Glenview Elementary School.
School Description
School Summary and Highlights
- Enrolls 514 elementary school students from grades KG-6
- Ranks 2326th out of 5,423 elementary schools in CA.
- 2010 Overall School AYP Met Status: No
Additional Contact Information
- Mailing Address: 1301 East Orangethorpe Ave., Placentia, CA 92870
School District Details
- Placentia-Yorba Linda Unified School District
- Per-Pupil Spending: $8,544
- Graduation Rate: 85.1%
- Dropout Rate: 1.5%
- Students Per Teacher: 24.5
- Enrolled Students: 25,907
Faculty Details and Student Enrollment
Students and Faculty
- Total Students Enrolled: 514
- Total Full Time "Equivalent" Teachers: 18.0
- Average Student-To-Teacher Ratio: 28.6
Students Gender Breakdown
- Males: 257 (50.0%)
- Females: 257 (50.0%)
Free Lunch Student Eligibility Breakdown
- Eligible for Reduced Lunch: 55 (10.7%)
- Eligible for Free Lunch: 104 (20.2%)
- Eligible for Either Reduced or Free Lunch: 159 (30.9%)
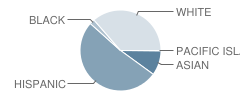
Student Enrollment Distribution by Race / Ethnicity
| Number | Percent | |
|---|---|---|
| American Indian | - | - |
| Black | 10 | 1.9% |
| Asian | 49 | 9.5% |
| Hispanic | 258 | 50.2% |
| White | 182 | 35.4% |
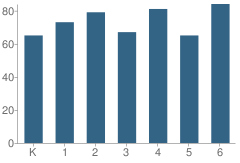
Number of Students Per Grade
| Number | Percent | |
|---|---|---|
| Kindergarten | 65 | 12.6% |
| 1st Grade | 73 | 14.2% |
| 2nd Grade | 79 | 15.4% |
| 3rd Grade | 67 | 13.0% |
| 4th Grade | 81 | 15.8% |
| 5th Grade | 65 | 12.6% |
| 6th Grade | 84 | 16.3% |
Teacher Education Background (2009)
Percent With Master's Degree
School:
65.4%
District:
78.9%
Percent With Bachelor's Degree: 3.8%
Teacher Credentials & Experience (2009)
Percent of Teachers With Credentials: 100.0%
Number of Certificated Staff: 26.0
Average Number of Years of Teacher Experience: 17.5
Average Age
School:
49.6
District:
51.4
Source: CA Department of Education, Source: NCES 2009-2010
School Ratings and Reviews
Be The First To Review Glenview Elementary School!
School Map and Similar Schools Nearby
Click to Activate Map of Nearby School Campuses
Private
Public
This School
Similar Schools Nearby
| Linda Vista Elementary School KG-5 | 438 Students | 0.8 miles away | Not Yet Rated | |
| Crescent Elementary School KG-6 | 740 Students | 1.3 miles away | Not Yet Rated | |
| Riverdale Elementary School KG-6 | 246 Students | 1.3 miles away | Not Yet Rated | |
| Glenknoll Elementary School KG-6 | 493 Students | 1.4 miles away | Not Yet Rated | |
| Van Buren Elementary School KG-6 | 666 Students | 1.5 miles away |  5 out of 5 | |
| Fairmont Elementary School KG-6 | 965 Students | 1.8 miles away | Not Yet Rated | |
| Mabel M. Paine Elementary School KG-5 | 438 Students | 2.0 miles away | Not Yet Rated | |
| Imperial Elementary School KG-6 | 381 Students | 2.1 miles away | Not Yet Rated | |
| Nohl Canyon Elementary School KG-6 | 541 Students | 2.3 miles away | Not Yet Rated | |
| Woodsboro Elementary School KG-6 | 508 Students | 2.3 miles away | Not Yet Rated | |
Compare This School To Nearby Schools ->
School Community Forum

Join a discussion about Glenview Elementary School and talk to others in the community including students, parents, teachers, and administrators.
Popular Discussion Topics
- Admissions and Registration Questions (e.g. Dress Code and Discipline Policy)
- School Calendar and Upcoming Events (e.g. Graduation)
- After School Programs, Extracurricular Activities, and Athletics (e.g. Football)
- News and Announcements (e.g. Yearbook and Class Supply List Details)
- Graduate and Alumni Events (e.g. Organizing Class Reunions)
Navigation
Can't Find What You Are Looking For?
Rankings
Nearby Cities
Sponsored Links
K-12 Articles

School's out for Recess
Recess used to be the best part of school; that and lunch. But today, a shocking two-thirds of...
Recess used to be the best part of school; that and lunch. But today, a shocking two-thirds of...

Imho
I was watching Headline News's news ticker when I read something that made me LOL. The ticker said...
I was watching Headline News's news ticker when I read something that made me LOL. The ticker said...

Feeling Good in Your Own Skin
Body image is a very touchy issue with today's kids. Since the 1950s, when Barbie was first...
Body image is a very touchy issue with today's kids. Since the 1950s, when Barbie was first...