Quincy Junior-High School
Rating
Not Available
Not Available

No Reviews Yet
Find Old Friends From Quincy Junior-High School
Use the form below to search for alumni from Quincy Junior-High School.
School Description
School Summary and Highlights
- Enrolls 315 middle and high school students from grades 7-12
- Ranks 237th out of 1,197 high schools in CA.
- 2010 Overall School AYP Met Status: No
Additional Contact Information
- Mailing Address: 6 Quincy Junction Rd., Quincy, CA 95971
School District Details
- Plumas Unified School District
- Per-Pupil Spending: $9,224
- Graduation Rate: 72.9%
- Dropout Rate: 2.9%
- Students Per Teacher: 18.7
- Enrolled Students: 2,370
Faculty Details and Student Enrollment
Students and Faculty
- Total Students Enrolled: 315
- Total Full Time "Equivalent" Teachers: 15.3
- Average Student-To-Teacher Ratio: 20.6
Students Gender Breakdown
- Males: 149 (47.3%)
- Females: 166 (52.7%)
Free Lunch Student Eligibility Breakdown
- Eligible for Reduced Lunch: 37 (11.7%)
- Eligible for Free Lunch: 78 (24.8%)
- Eligible for Either Reduced or Free Lunch: 115 (36.5%)
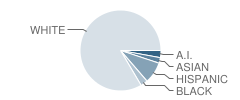
Student Enrollment Distribution by Race / Ethnicity
| Number | Percent | |
|---|---|---|
| American Indian | 9 | 2.9% |
| Black | 9 | 2.9% |
| Asian | 7 | 2.2% |
| Hispanic | 27 | 8.6% |
| White | 263 | 83.5% |
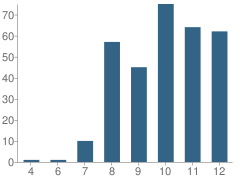
Number of Students Per Grade
| Number | Percent | |
|---|---|---|
| 4th Grade | 1 | 0.3% |
| 6th Grade | 1 | 0.3% |
| 7th Grade | 10 | 3.2% |
| 8th Grade | 57 | 18.1% |
| 9th Grade | 45 | 14.3% |
| 10th Grade | 75 | 23.8% |
| 11th Grade | 64 | 20.3% |
| 12th Grade | 62 | 19.7% |
Graduates Information (2010)
Graduation Rate
School:
93.6%
District:
92.7%
State:
78.6%
Teacher Education Background (2009)
Percent With Master's Degree
School:
23.8%
District:
42.9%
Percent With Bachelor's Degree
School:
4.8%
District:
14.3%
Teacher Credentials & Experience (2009)
Percent of Teachers With Credentials: 100.0%
Number of Certificated Staff: 21.0
Average Number of Years of Teacher Experience: 20.9
Average Age
School:
50.0
District:
51.9
Source: CA Department of Education, Source: NCES 2009-2010
School Ratings and Reviews
Be The First To Review Quincy Junior-High School!
School Map and Similar Schools Nearby
Click to Activate Map of Nearby School Campuses
Private
Public
This School
Similar Schools Nearby
| Greenville Junior-High School 7-12 | 111 Students | 12.4 miles away | Not Yet Rated | |
| Downieville Junior-High School 7-12 | 36 Students | 28.1 miles away | Not Yet Rated | |
Compare This School To Nearby Schools ->
School Community Forum

Join a discussion about Quincy Junior-High School and talk to others in the community including students, parents, teachers, and administrators.
Popular Discussion Topics
- Admissions and Registration Questions (e.g. Dress Code and Discipline Policy)
- School Calendar and Upcoming Events (e.g. Graduation)
- After School Programs, Extracurricular Activities, and Athletics (e.g. Football)
- News and Announcements (e.g. Yearbook and Class Supply List Details)
- Graduate and Alumni Events (e.g. Organizing Class Reunions)
Navigation
Can't Find What You Are Looking For?
Rankings
Nearby Cities
Sponsored Links
K-12 Articles

Siblings and Individual Identity in High School
When the first day of high school looms in the near future, teens are both excited and anxious....
When the first day of high school looms in the near future, teens are both excited and anxious....

Information on Cyberbullying
What is Cyberbullying? Cyberbullying is a new form of harassment, emotional abuse,...
What is Cyberbullying? Cyberbullying is a new form of harassment, emotional abuse,...

Is Your Child Happy at School?
As a parent, you'd love to have your child share all of his feelings with you. It would be so easy...
As a parent, you'd love to have your child share all of his feelings with you. It would be so easy...