Fremont Middle School
Rating
Not Available
Not Available

5 out of 5 | 1 Review
Find Old Friends From Fremont Middle School
Use the form below to search for alumni from Fremont Middle School.
School Description
School Summary and Highlights
- Enrolls 648 middle school students from grades 6-8
- Ranks 1997th out of 2,050 middle schools in CA.
- 2010 Overall School AYP Met Status: No
Additional Contact Information
- Mailing Address: 725 West Franklin Ave., Pomona, CA 91766
School Operational Details
- Title I EligibleAll students of this school are eligible for participation in authorized programs.
School District Details
- Pomona Unified School District
- Per-Pupil Spending: $10,397
- Graduation Rate: 51.9%
- Dropout Rate: 6.1%
- Students Per Teacher: 22.8
- Enrolled Students: 28,917
Faculty Details and Student Enrollment
Students and Faculty
- Total Students Enrolled: 648
- Total Full Time "Equivalent" Teachers: 34.0
- Average Student-To-Teacher Ratio: 19.1
Students Gender Breakdown
- Males: 329 (50.8%)
- Females: 319 (49.2%)
Free Lunch Student Eligibility Breakdown
- Eligible for Reduced Lunch: 74 (11.4%)
- Eligible for Free Lunch: 553 (85.3%)
- Eligible for Either Reduced or Free Lunch: 627 (96.8%)
Student Enrollment Distribution by Race / Ethnicity
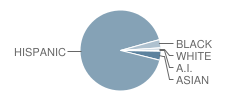
| Number | Percent | |
|---|---|---|
| American Indian | 2 | 0.3% |
| Black | 21 | 3.2% |
| Asian | 23 | 3.5% |
| Hispanic | 593 | 91.5% |
| White | 7 | 1.1% |
Number of Students Per Grade
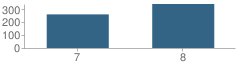
| Number | Percent | |
|---|---|---|
| 7th Grade | 259 | 40.0% |
| 8th Grade | 339 | 52.3% |
| Ungraded | 50 | 7.7% |
Teacher Education Background (2009)
Percent With Ph.D.
School:
2.4%
District:
5.0%
Percent With Master's Degree
School:
31.0%
District:
19.3%
Percent With Bachelor's Degree
School:
9.5%
District:
8.1%
Teacher Credentials & Experience (2009)
Percent of Teachers With Emergency Credentials: 5.3%
Percent of Teachers With Credentials: 86.8%
Number of Certificated Staff: 42.0
Average Number of Years of Teacher Experience: 12.6
Average Age
School:
45.1
District:
47.7
Source: CA Department of Education, Source: NCES 2009-2010
School Ratings and Reviews
Overall Rating: 5

5 out of 5 | 1 Review
The Overall Rating is the school's average rating from parents, students, school faculty and staff. The highest rating is five apples and the lowest is one apple.
Share Your Review About This School
1 review for Fremont Middle School
- Reviewed by Parent/Guardian on January 15, 2010
- Rating:
 (5 / 5) Flag as inappropriate
 - i hate this school!
School Map and Similar Schools Nearby
Click to Activate Map of Nearby School Campuses
Private
Public
This School
Similar Schools Nearby
| Lexington Elementary School KG-7 | 699 Students | 0.3 miles away |  5 out of 5 | |
| Madison Elementary School KG-6 | 662 Students | 0.4 miles away | Not Yet Rated | |
| Vejar Elementary School KG-7 | 914 Students | 0.5 miles away | 5 out of 5 | |
| Ignacio L. Lopez School 4-6 | 239 Students | 0.9 miles away | Not Yet Rated | |
| Philadelphia Elementary School KG-6 | 829 Students | 0.9 miles away | 5 out of 5 | |
| Decker Elementary School KG-6 | 560 Students | 0.9 miles away | Not Yet Rated | |
| Alcott Elementary School KG-6 | 967 Students | 0.9 miles away | Not Yet Rated | |
| Simons Middle School 6-8 | 823 Students | 1.0 miles away |  4.5 out of 5 | |
| Westmont Elementary School KG-6 | 599 Students | 1.5 miles away | Not Yet Rated | |
| Ranch Hills Elementary School KG-6 | 473 Students | 1.7 miles away | 5 out of 5 | |
Compare This School To Nearby Schools ->
School Community Forum

Join a discussion about Fremont Middle School and talk to others in the community including students, parents, teachers, and administrators.
Popular Discussion Topics
- Admissions and Registration Questions (e.g. Dress Code and Discipline Policy)
- School Calendar and Upcoming Events (e.g. Graduation)
- After School Programs, Extracurricular Activities, and Athletics (e.g. Football)
- News and Announcements (e.g. Yearbook and Class Supply List Details)
- Graduate and Alumni Events (e.g. Organizing Class Reunions)
Navigation
Can't Find What You Are Looking For?
Rankings
Nearby Cities
Sponsored Links
K-12 Articles

Public or Private?
Daniel attended private school until sixth grade, when he was diagnosed with Asperger’s Syndrome, a...
Daniel attended private school until sixth grade, when he was diagnosed with Asperger’s Syndrome, a...

Keep Kids Learning All Summer
Early in the 20th century schools in urban districts operated all year ‘round. However, in rural...
Early in the 20th century schools in urban districts operated all year ‘round. However, in rural...

National Memories
Few events are seared into our memory, and bring the country together-not as Democrat and...
Few events are seared into our memory, and bring the country together-not as Democrat and...