Garey High School
Rating
Not Available
Not Available

4 out of 5 | 1 Review
Find Old Friends From Garey High School
Use the form below to search for alumni from Garey High School.
School Description
School Summary and Highlights
- Enrolls 2,100 high school students from grades 9-12
- Ranks 1087th out of 1,197 high schools in CA.
- 2010 Overall School AYP Met Status: No
Additional Contact Information
- Mailing Address: 321 West Lexington Ave., Pomona, CA 91766
School Operational Details
- Title I EligibleAll students of this school are eligible for participation in authorized programs.
School District Details
- Pomona Unified School District
- Per-Pupil Spending: $10,397
- Graduation Rate: 51.9%
- Dropout Rate: 6.1%
- Students Per Teacher: 22.8
- Enrolled Students: 28,917
Faculty Details and Student Enrollment
Students and Faculty
- Total Students Enrolled: 2,100
- Total Full Time "Equivalent" Teachers: 88.0
- Average Student-To-Teacher Ratio: 23.9
Students Gender Breakdown
- Males: 1,089 (51.9%)
- Females: 1,011 (48.1%)
Free Lunch Student Eligibility Breakdown
- Eligible for Reduced Lunch: 275 (13.1%)
- Eligible for Free Lunch: 1,587 (75.6%)
- Eligible for Either Reduced or Free Lunch: 1,862 (88.7%)
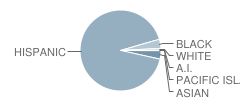
Student Enrollment Distribution by Race / Ethnicity
| Number | Percent | |
|---|---|---|
| American Indian | 1 | 0.05% |
| Black | 76 | 3.6% |
| Asian | 71 | 3.4% |
| Hispanic | 1,927 | 91.8% |
| White | 18 | 0.9% |
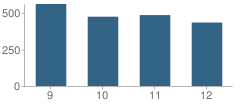
Number of Students Per Grade
| Number | Percent | |
|---|---|---|
| 9th Grade | 562 | 26.8% |
| 10th Grade | 475 | 22.6% |
| 11th Grade | 486 | 23.1% |
| 12th Grade | 435 | 20.7% |
| Ungraded | 142 | 6.8% |
Graduates Information (2010)
Graduation Rate
School:
75.0%
District:
74.6%
State:
78.6%
Teacher Education Background (2009)
Percent With Ph.D.
School:
91.7%
District:
5.0%
Percent With Master's Degree
School:
26.6%
District:
19.3%
Percent With Bachelor's Degree
School:
12.8%
District:
8.1%
Teacher Credentials & Experience (2009)
Percent of Teachers With Emergency Credentials: 4.2%
Percent of Teachers With Credentials: 89.5%
Number of Certificated Staff: 109.0
Average Number of Years of Teacher Experience: 13.0
Average Age
School:
46.1
District:
47.7
Source: CA Department of Education, Source: NCES 2009-2010
School Ratings and Reviews
Overall Rating: 4

4 out of 5 | 1 Review
The Overall Rating is the school's average rating from parents, students, school faculty and staff. The highest rating is five apples and the lowest is one apple.
Share Your Review About This School
1 review for Garey High School
- Reviewed by Former Student on July 14, 2008
- Rating:
 (4 / 5) Flag as inappropriate
 - I had some fabulous teachers and not so who just needed the pay check. Over all I miss my English teacher. Now I'm in college as a senior finishing up my major in teaching special education. She gave me hope that someday I'll make a good teacher, well at 40 I'm making something out of my life I have done other careers just didn't love my job. I Thank her for my accomplishment's Forever, Graduate of 1986
School Map and Similar Schools Nearby
Click to Activate Map of Nearby School Campuses
Private
Public
This School
Similar Schools Nearby
| Diamond Ranch High School 9-12 | 1,815 Students | 1.6 miles away |  5 out of 5 | |
| Canyon Hills Junior High School 7-8 | 1,126 Students | 2.3 miles away | Not Yet Rated | |
| Ramona Junior High School 7-8 | 887 Students | 2.7 miles away |  4.5 out of 5 | |
| Don Antonio Lugo High School 9-12 | 2,290 Students | 2.8 miles away | Not Yet Rated | |
| Ganesha High School 9-12 | 1,599 Students | 2.8 miles away |  4 out of 5 | |
| Ruben S. Ayala High School 9-12 | 2,478 Students | 3.1 miles away | Not Yet Rated | |
| Pomona High School 9-12 | 1,774 Students | 3.3 miles away | 4.5 out of 5 | |
| Montclair High School 9-12 | 3,221 Students | 3.8 miles away |  3 out of 5 | |
| Chino High School 9-12 | 2,767 Students | 3.9 miles away | Not Yet Rated | |
| International Polytechnic High School 9-12 | 586 Students | 4.1 miles away | 4 out of 5 | |
Compare This School To Nearby Schools ->
School Community Forum

Join a discussion about Garey High School and talk to others in the community including students, parents, teachers, and administrators.
Popular Discussion Topics
- Admissions and Registration Questions (e.g. Dress Code and Discipline Policy)
- School Calendar and Upcoming Events (e.g. Graduation)
- After School Programs, Extracurricular Activities, and Athletics (e.g. Football)
- News and Announcements (e.g. Yearbook and Class Supply List Details)
- Graduate and Alumni Events (e.g. Organizing Class Reunions)
Navigation
Can't Find What You Are Looking For?
Rankings
Nearby Cities
Sponsored Links
K-12 Articles

Help Your Child Achieve Success in Middle School
Middle school is for children between the ages of 10 and 14 years. At this time children begin to...
Middle school is for children between the ages of 10 and 14 years. At this time children begin to...

Assisting Students to Overcome Test Anxiety
Every human copes with anxiety at one time or another. It is a basic emotion that we feel when...
Every human copes with anxiety at one time or another. It is a basic emotion that we feel when...

Is Your Child's Teacher a Bully?
We've all heard about kids being bullied by peers. Kids taunt, tease, pull hair, shove and push...
We've all heard about kids being bullied by peers. Kids taunt, tease, pull hair, shove and push...