Yorba Elementary School
Rating
Not Available
Not Available

5 out of 5 | 1 Review
Find Old Friends From Yorba Elementary School
Use the form below to search for alumni from Yorba Elementary School.
School Description
School Summary and Highlights
- Enrolls 290 elementary school students from grades KG-6
- Ranks 5293rd out of 5,423 elementary schools in CA.
- 2010 Overall School AYP Met Status: No
Additional Contact Information
- Mailing Address: 250 West La Verne Ave., Pomona, CA 91767
School Operational Details
- Title I EligibleAll students of this school are eligible for participation in authorized programs.
School District Details
- Pomona Unified School District
- Per-Pupil Spending: $10,397
- Graduation Rate: 51.9%
- Dropout Rate: 6.1%
- Students Per Teacher: 22.8
- Enrolled Students: 28,917
Faculty Details and Student Enrollment
Students and Faculty
- Total Students Enrolled: 290
- Total Full Time "Equivalent" Teachers: 18.0
- Average Student-To-Teacher Ratio: 16.1
Students Gender Breakdown
- Males: 171 (59.0%)
- Females: 119 (41.0%)
Free Lunch Student Eligibility Breakdown
- Eligible for Reduced Lunch: 54 (18.6%)
- Eligible for Free Lunch: 192 (66.2%)
- Eligible for Either Reduced or Free Lunch: 246 (84.8%)
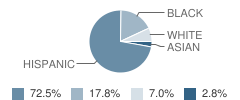
Student Enrollment Distribution by Race / Ethnicity
| Number | Percent | |
|---|---|---|
| American Indian | - | - |
| Black | 51 | 17.6% |
| Asian | 8 | 2.8% |
| Hispanic | 208 | 71.7% |
| White | 20 | 6.9% |
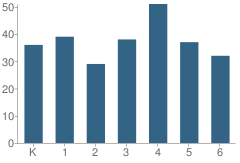
Number of Students Per Grade
| Number | Percent | |
|---|---|---|
| Kindergarten | 36 | 12.4% |
| 1st Grade | 39 | 13.4% |
| 2nd Grade | 29 | 10.0% |
| 3rd Grade | 38 | 13.1% |
| 4th Grade | 51 | 17.6% |
| 5th Grade | 37 | 12.8% |
| 6th Grade | 32 | 11.0% |
| Ungraded | 28 | 9.7% |
Teacher Education Background (2009)
Percent With Ph.D.
School:
5.0%
District:
5.0%
Percent With Master's Degree
School:
40.0%
District:
19.3%
Percent With Bachelor's Degree
School:
20.0%
District:
8.1%
Teacher Credentials & Experience (2009)
Percent of Teachers With Emergency Credentials: 5.3%
Percent of Teachers With Credentials: 84.2%
Number of Certificated Staff: 20.0
Average Number of Years of Teacher Experience: 11.2
Average Age
School:
46.1
District:
47.7
Source: CA Department of Education, Source: NCES 2009-2010
School Ratings and Reviews
Overall Rating: 5

5 out of 5 | 1 Review
The Overall Rating is the school's average rating from parents, students, school faculty and staff. The highest rating is five apples and the lowest is one apple.
Share Your Review About This School
1 review for Yorba Elementary School
- Reviewed by Parent/Guardian on April 27, 2010
- Rating:
 (5 / 5) Flag as inappropriate
 - It has been about 6 years since i got out of this school and i liked it for the most part :) sucked that my mom was a proctor :/
School Map and Similar Schools Nearby
Click to Activate Map of Nearby School Campuses
Private
Public
This School
Similar Schools Nearby
| San Jose Elementary School KG-7 | 584 Students | 0.4 miles away | Not Yet Rated | |
| C. Joseph Barfield Elementary School KG-6 | 529 Students | 1.0 miles away | Not Yet Rated | |
| Harrison Elementary School KG-7 | 480 Students | 1.0 miles away |  5 out of 5 | |
| Lincoln Elementary School KG-6 | 575 Students | 1.2 miles away | Not Yet Rated | |
| Allison Elementary School KG-6 | 400 Students | 1.4 miles away | Not Yet Rated | |
| J. Marion Roynon Elementary School KG-5 | 727 Students | 1.4 miles away | Not Yet Rated | |
| Roosevelt Elementary School KG-5 | 818 Students | 1.6 miles away | Not Yet Rated | |
| Kingsley Elementary School KG-5 | 691 Students | 1.6 miles away | 5 out of 5 | |
| San Antonio Elementary School KG-5 | 463 Students | 1.8 miles away | Not Yet Rated | |
| Mountain View Elementary School KG-6 | 427 Students | 1.8 miles away | Not Yet Rated | |
Compare This School To Nearby Schools ->
School Community Forum

Join a discussion about Yorba Elementary School and talk to others in the community including students, parents, teachers, and administrators.
Popular Discussion Topics
- Admissions and Registration Questions (e.g. Dress Code and Discipline Policy)
- School Calendar and Upcoming Events (e.g. Graduation)
- After School Programs, Extracurricular Activities, and Athletics (e.g. Football)
- News and Announcements (e.g. Yearbook and Class Supply List Details)
- Graduate and Alumni Events (e.g. Organizing Class Reunions)
Navigation
Can't Find What You Are Looking For?
Rankings
Nearby Cities
Sponsored Links
K-12 Articles

Educators and Childhood Obesity
Obesity in childhood is rising to epidemic proportions in America and educators should be...
Obesity in childhood is rising to epidemic proportions in America and educators should be...

Teaching Children Respect
Statistics prove that there are many different family types in today's society. Grandparents or a...
Statistics prove that there are many different family types in today's society. Grandparents or a...

Strategies to Help Kids Cope with Stress
Many parents believe that kids don't experience stress. Nothing could be further from the truth....
Many parents believe that kids don't experience stress. Nothing could be further from the truth....