Clifford Elementary School
Rating
Not Available
Not Available

5 out of 5 | 1 Review
Find Old Friends From Clifford Elementary School
Use the form below to search for alumni from Clifford Elementary School.
School Description
School Summary and Highlights
- Enrolls 794 elementary school students from grades KG-8
- Ranks 785th out of 2,050 middle schools in CA.
- 2010 Overall School AYP Met Status: Yes
Additional Contact Information
- Mailing Address: 750 Bradford St., Redwood City, CA 94063
School District Details
- Redwood City Elementary School District
- Per-Pupil Spending: $10,988
- Students Per Teacher: 20.7
- Enrolled Students: 9,020
Faculty Details and Student Enrollment
Students and Faculty
- Total Students Enrolled: 794
- Total Full Time "Equivalent" Teachers: 35.8
- Average Student-To-Teacher Ratio: 22.2
Students Gender Breakdown
- Males: 422 (53.1%)
- Females: 372 (46.9%)
Free Lunch Student Eligibility Breakdown
- Eligible for Reduced Lunch: 56 (7.1%)
- Eligible for Free Lunch: 223 (28.1%)
- Eligible for Either Reduced or Free Lunch: 279 (35.1%)
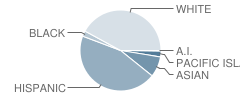
Student Enrollment Distribution by Race / Ethnicity
| Number | Percent | |
|---|---|---|
| American Indian | 3 | 0.4% |
| Black | 18 | 2.3% |
| Asian | 65 | 8.2% |
| Hispanic | 353 | 44.5% |
| White | 330 | 41.6% |
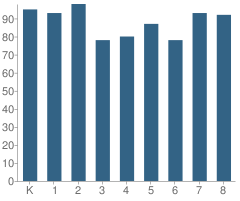
Number of Students Per Grade
| Number | Percent | |
|---|---|---|
| Kindergarten | 95 | 12.0% |
| 1st Grade | 93 | 11.7% |
| 2nd Grade | 98 | 12.3% |
| 3rd Grade | 78 | 9.8% |
| 4th Grade | 80 | 10.1% |
| 5th Grade | 87 | 11.0% |
| 6th Grade | 78 | 9.8% |
| 7th Grade | 93 | 11.7% |
| 8th Grade | 92 | 11.6% |
Teacher Education Background (2009)
Percent With Master's Degree
School:
4.4%
District:
1.8%
Percent With Bachelor's Degree
School:
2.2%
District:
7.0%
Teacher Credentials & Experience (2009)
Percent of Teachers With Emergency Credentials: 2.3%
Percent of Teachers With Credentials: 93.0%
Number of Certificated Staff: 45.0
Average Number of Years of Teacher Experience: 11.9
Average Age
School:
42.5
District:
44.0
Source: CA Department of Education, Source: NCES 2009-2010
School Ratings and Reviews
Overall Rating: 5

5 out of 5 | 1 Review
The Overall Rating is the school's average rating from parents, students, school faculty and staff. The highest rating is five apples and the lowest is one apple.
Share Your Review About This School
1 review for Clifford Elementary School
- Reviewed by Parent/Guardian on January 06, 2009
- Rating:
 (5 / 5) Flag as inappropriate
 - clifford school
School Map and Similar Schools Nearby
Click to Activate Map of Nearby School Campuses
Private
Public
This School
Similar Schools Nearby
| John Gill Elementary School KG-5 | 455 Students | 1.3 miles away | Not Yet Rated | |
| Central Middle School 5-8 | 608 Students | 1.4 miles away | Not Yet Rated | |
| Roosevelt Elementary School KG-5 | 340 Students | 1.4 miles away | Not Yet Rated | |
| North Star Academy 3-8 | 536 Students | 1.5 miles away | Not Yet Rated | |
| Roy Cloud Elementary School KG-8 | 767 Students | 1.6 miles away | Not Yet Rated | |
| Hawes Elementary School KG-5 | 376 Students | 1.7 miles away | Not Yet Rated | |
| Adelante Spanish Immersion School KG-6 | 514 Students | 2.2 miles away |  5 out of 5 | |
| Henry Ford Elementary School KG-5 | 477 Students | 2.4 miles away | 5 out of 5 | |
| Hoover Elementary School KG-8 | 856 Students | 2.7 miles away | Not Yet Rated | |
| Selby Lane Elementary School KG-8 | 724 Students | 2.8 miles away | 5 out of 5 | |
Compare This School To Nearby Schools ->
School Community Forum

Join a discussion about Clifford Elementary School and talk to others in the community including students, parents, teachers, and administrators.
Popular Discussion Topics
- Admissions and Registration Questions (e.g. Dress Code and Discipline Policy)
- School Calendar and Upcoming Events (e.g. Graduation)
- After School Programs, Extracurricular Activities, and Athletics (e.g. Football)
- News and Announcements (e.g. Yearbook and Class Supply List Details)
- Graduate and Alumni Events (e.g. Organizing Class Reunions)
Navigation
Can't Find What You Are Looking For?
Rankings
Nearby Cities
Sponsored Links
K-12 Articles

Siblings and Individual Identity in High School
When the first day of high school looms in the near future, teens are both excited and anxious....
When the first day of high school looms in the near future, teens are both excited and anxious....

Teaching Your Child Study Skills
Many children who have the capability to get good grades experience frustration because of low...
Many children who have the capability to get good grades experience frustration because of low...

Keep Kids Learning All Summer
Early in the 20th century schools in urban districts operated all year ‘round. However, in rural...
Early in the 20th century schools in urban districts operated all year ‘round. However, in rural...