Eisenhower High School

No Reviews Yet
Find Old Friends From Eisenhower High School
Use the form below to search for alumni from Eisenhower High School.
School Description
School Summary and Highlights
- Enrolls 2,395 high school students from grades 9-12
- Ranks 820th out of 1,197 high schools in CA.
- 2010 Overall School AYP Met Status: No
Additional Contact Information
- Mailing Address: 1321 North Lilac Ave., Rialto, CA 92376
School District Details
- Rialto Unified School District
- Per-Pupil Spending: $8,594
- Graduation Rate: 55.5%
- Dropout Rate: 6.2%
- Students Per Teacher: 23.6
- Enrolled Students: 27,138
Faculty Details and Student Enrollment
Students and Faculty
- Total Students Enrolled: 2,395
- Total Full Time "Equivalent" Teachers: 100.0
- Average Student-To-Teacher Ratio: 24.0
Students Gender Breakdown
- Males: 1,196 (49.9%)
- Females: 1,199 (50.1%)
Free Lunch Student Eligibility Breakdown
- Eligible for Reduced Lunch: 212 (8.9%)
- Eligible for Free Lunch: 1,665 (69.5%)
- Eligible for Either Reduced or Free Lunch: 1,877 (78.4%)
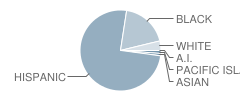
Student Enrollment Distribution by Race / Ethnicity

| Number | Percent | |
|---|---|---|
| American Indian | 3 | 0.1% |
| Black | 448 | 18.7% |
| Asian | 24 | 1.0% |
| Hispanic | 1,794 | 74.9% |
| White | 91 | 3.8% |
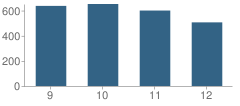
Number of Students Per Grade

| Number | Percent | |
|---|---|---|
| 9th Grade | 637 | 26.6% |
| 10th Grade | 652 | 27.2% |
| 11th Grade | 600 | 25.1% |
| 12th Grade | 506 | 21.1% |
Graduates Information (2010)
Graduation Rate
School:
61.7%
District:
69.9%
State:
78.6%
Teacher Education Background (2009)
Percent With Ph.D.
School:
90.1%
District:
2.9%
Percent With Master's Degree
School:
5.4%
District:
8.7%
Percent With Bachelor's Degree
School:
14.4%
District:
4.9%
Teacher Credentials & Experience (2009)
Percent of Teachers With Emergency Credentials: 3.2%
Percent of Teachers With Credentials: 88.2%
Number of Certificated Staff: 111.0
Average Number of Years of Teacher Experience: 15.1
Average Age
School:
45.3
District:
46.4
Source: CA Department of Education, Source: NCES 2009-2010
School Ratings and Reviews
Be The First To Review Eisenhower High School!
Sponsored Links
Test Scores and Performance Information
Overall School Rating
How is this determined?
The overall school rating shows that Eisenhower High School performed on average worse than many other schools across the state on CST state exams in the following subjects:
- CST Algebra I
- CST Algebra II
- CST Biology
- CST Chemistry
- CST Earth Science
- CST English-Language Arts
- CST General Mathematics
- CST Geometry
- CST Integrated Math 1
- CST Science
- CST Summative High School Math
- CST U.S. History
- CST World History
AYP Results (2010)
Overall AYP Met: No
ELA AYP Met: No
Math AYP Met: No
ACT Exam Results (2009)
Percent of Students Taking ACT Exam: 15.1%
Average Combined Score: 17.6
Percent Scoring At or Above 21: 21.4%
SAT Exam Results (2009)
Percent of Students Taking SAT Exam: 36.6%
Average Combined Score: 1,235.4
Critical Reading Average: 412.4
Math Average: 418.3
Writing Average: 404.7
Percent Scoring At or Above 1500: 17.7%
CST - Test Proficiency by Grade and Subject
Grade 9 - % of students at or above proficiency
| School | District | State | |
|---|---|---|---|
| CST Algebra I Test | |||
| 2010 | 24.0% | 13.0% | 22.0% |
| 2009 | 24.0% | 12.0% | 21.0% |
| 2008 | 14.0% | 8.0% | 18.0% |
| CST Biology Test | |||
| 2010 | 50.0% | 58.0% | 55.0% |
| 2009 | 33.0% | 51.0% | 51.0% |
| 2008 | 56.0% | 54.0% | 52.0% |
| CST Earth Science Test | |||
| 2010 | 17.0% | 16.0% | 35.0% |
| 2009 | 19.0% | 15.0% | 29.0% |
| 2008 | 13.0% | 11.0% | 31.0% |
| CST English-Language Arts Test | |||
| 2010 | 44.0% | 45.0% | 54.0% |
| 2009 | 35.0% | 37.0% | 50.0% |
| 2008 | 37.0% | 37.0% | 49.0% |
| CST Geometry Test | |||
| 2010 | 30.0% | 23.0% | 46.0% |
| 2009 | 33.0% | 19.0% | 47.0% |
| 2008 | 26.0% | 19.0% | 43.0% |
| CST World History Test | |||
| 2010 | 25.0% | 15.0% | 45.0% |
| 2009 | - | - | - |
| 2008 | 9.0% | 4.0% | 36.0% |
| CST General Mathematics Test | |||
| 2009 | 5.0% | 5.0% | 17.0% |
| 2008 | 7.0% | 11.0% | 18.0% |
Grade 10 - % of students at or above proficiency
| School | District | State | |
|---|---|---|---|
| CST Algebra I Test | |||
| 2010 | 7.0% | 7.0% | 12.0% |
| 2009 | 6.0% | 5.0% | 11.0% |
| 2008 | 1.0% | 1.0% | 9.0% |
| CST Algebra II Test | |||
| 2010 | 43.0% | 37.0% | 40.0% |
| 2009 | 56.0% | 27.0% | 37.0% |
| 2008 | 37.0% | 25.0% | 36.0% |
| CST Biology Test | |||
| 2010 | 26.0% | 23.0% | 38.0% |
| 2009 | 22.0% | 23.0% | 34.0% |
| 2008 | 20.0% | 15.0% | 35.0% |
| CST Chemistry Test | |||
| 2010 | 41.0% | 31.0% | 47.0% |
| 2009 | 51.0% | 27.0% | 44.0% |
| 2008 | 35.0% | 25.0% | 41.0% |
| CST Earth Science Test | |||
| 2010 | 6.0% | 5.0% | 29.0% |
| 2009 | 17.0% | 10.0% | 23.0% |
| 2008 | 7.0% | 7.0% | 23.0% |
| CST English-Language Arts Test | |||
| 2010 | 26.0% | 32.0% | 45.0% |
| 2009 | 33.0% | 32.0% | 44.0% |
| 2008 | 21.0% | 25.0% | 41.0% |
| CST Geometry Test | |||
| 2010 | 6.0% | 4.0% | 14.0% |
| 2009 | 9.0% | 5.0% | 14.0% |
| 2008 | 1.0% | 1.0% | 12.0% |
| CST Science Test | |||
| 2010 | 32.0% | 34.0% | 46.0% |
| 2009 | 37.0% | 34.0% | 44.0% |
| 2008 | 26.0% | 25.0% | 40.0% |
| CST World History Test | |||
| 2010 | 24.0% | 27.0% | 42.0% |
| 2009 | 25.0% | 25.0% | 38.0% |
| 2008 | 16.0% | 19.0% | 33.0% |
Grade 11 - % of students at or above proficiency
| School | District | State | |
|---|---|---|---|
| CST Algebra I Test | |||
| 2010 | 12.0% | 8.0% | 8.0% |
| 2009 | - | - | - |
| 2008 | 7.0% | 6.0% | 5.0% |
| CST Algebra II Test | |||
| 2010 | 19.0% | 9.0% | 14.0% |
| 2009 | 10.0% | 5.0% | 12.0% |
| 2008 | 11.0% | 5.0% | 11.0% |
| CST Biology Test | |||
| 2010 | 22.0% | 25.0% | 46.0% |
| 2009 | 23.0% | 22.0% | 41.0% |
| 2008 | 14.0% | 22.0% | 39.0% |
| CST Chemistry Test | |||
| 2010 | 38.0% | 23.0% | 30.0% |
| 2009 | 19.0% | 12.0% | 27.0% |
| 2008 | 10.0% | 6.0% | 25.0% |
| CST Earth Science Test | |||
| 2010 | 12.0% | 15.0% | 32.0% |
| 2009 | 10.0% | 11.0% | 26.0% |
| 2008 | 25.0% | 10.0% | 28.0% |
| CST English-Language Arts Test | |||
| 2010 | 31.0% | 34.0% | 42.0% |
| 2009 | 28.0% | 25.0% | 40.0% |
| 2008 | 22.0% | 21.0% | 37.0% |
| CST Geometry Test | |||
| 2010 | 1.0% | 1.0% | 6.0% |
| 2009 | 2.0% | - | 7.0% |
| CST Integrated Math 1 Test | |||
| 2010 | 6.0% | 4.0% | 11.0% |
| 2009 | 6.0% | 6.0% | 9.0% |
| CST Summative High School Math Test | |||
| 2010 | 39.0% | 30.0% | 50.0% |
| 2009 | 26.0% | 28.0% | 47.0% |
| 2008 | 20.0% | 23.0% | 43.0% |
| CST U.S. History Test | |||
| 2010 | 43.0% | 33.0% | 45.0% |
| 2009 | 36.0% | 29.0% | 44.0% |
| 2008 | 23.0% | 21.0% | 38.0% |
| CST World History Test | |||
| 2010 | 25.0% | 10.0% | 15.0% |
| 2009 | 27.0% | 12.0% | 11.0% |
| 2008 | 5.0% | 7.0% | 9.0% |
End of Course - % of students at or above proficiency
| School | District | State | |
|---|---|---|---|
| CST Algebra I Test | |||
| 2010 | 20.0% | 16.0% | 31.0% |
| 2009 | 19.0% | 13.0% | 28.0% |
| 2008 | 10.0% | 10.0% | 25.0% |
| CST Algebra II Test | |||
| 2010 | 25.0% | 21.0% | 31.0% |
| 2009 | 22.0% | 14.0% | 28.0% |
| 2008 | 19.0% | 13.0% | 27.0% |
| CST Biology Test | |||
| 2010 | 29.0% | 34.0% | 46.0% |
| 2009 | 24.0% | 30.0% | 42.0% |
| 2008 | 23.0% | 28.0% | 42.0% |
| CST Chemistry Test | |||
| 2010 | 38.0% | 27.0% | 38.0% |
| 2009 | 26.0% | 19.0% | 36.0% |
| 2008 | 16.0% | 15.0% | 32.0% |
| CST Earth Science Test | |||
| 2010 | 16.0% | 15.0% | 33.0% |
| 2009 | 19.0% | 14.0% | 28.0% |
| 2008 | 14.0% | 10.0% | 28.0% |
| CST Geometry Test | |||
| 2010 | 10.0% | 10.0% | 27.0% |
| 2009 | 10.0% | 8.0% | 26.0% |
| 2008 | 4.0% | 6.0% | 24.0% |
| CST Integrated Math 1 Test | |||
| 2010 | 7.0% | 4.0% | 13.0% |
| 2009 | 6.0% | 5.0% | 11.0% |
| CST Summative High School Math Test | |||
| 2010 | 38.0% | 31.0% | 54.0% |
| 2009 | 27.0% | 29.0% | 50.0% |
| 2008 | 20.0% | 23.0% | 47.0% |
| CST World History Test | |||
| 2010 | 24.0% | 26.0% | 41.0% |
| 2009 | 26.0% | 25.0% | 38.0% |
| 2008 | 17.0% | 18.0% | 33.0% |
| CST General Mathematics Test | |||
| 2009 | 5.0% | 3.0% | 26.0% |
| 2008 | 7.0% | 9.0% | 27.0% |
Source: CA Department of Education 2009-2010
School Map and Similar Schools Nearby
Click to Activate Map of Nearby School Campuses
Private
Public
This School
Similar Schools Nearby
| Rialto High School 9-12 | 2,971 Students | 1.6 miles away | ![]() 4.5 out of 5 | |
| Wilmer Amina Carter High School 9-12 | 2,563 Students | 2.0 miles away | ![]() 2.5 out of 5 | |
| Arroyo Valley High School 9-12 | 3,007 Students | 2.4 miles away | ![]() 5 out of 5 | |
| A. B. Fontana Miller High School 9-12 | 2,902 Students | 4.0 miles away | Not Yet Rated | |
| Colton High School 9-12 | 3,308 Students | 4.6 miles away | ![]() 4 out of 5 | |
| Richardson Preparatory High School 6-8 | 612 Students | 4.7 miles away | ![]() 5 out of 5 | |
| San Bernardino High School 9-12 | 2,456 Students | 4.9 miles away | ![]() 4 out of 5 | |
| Bloomington High School 9-12 | 2,972 Students | 5.0 miles away | ![]() 1.5 out of 5 | |
| Fontana High School 9-12 | 3,849 Students | 5.2 miles away | ![]() 5 out of 5 | |
| Summit High School 9-12 | 2,770 Students | 5.3 miles away | ![]() 5 out of 5 | |
Compare This School To Nearby Schools ->
School Community Forum

Join a discussion about Eisenhower High School and talk to others in the community including students, parents, teachers, and administrators.
Popular Discussion Topics
- Admissions and Registration Questions (e.g. Dress Code and Discipline Policy)
- School Calendar and Upcoming Events (e.g. Graduation)
- After School Programs, Extracurricular Activities, and Athletics (e.g. Football)
- News and Announcements (e.g. Yearbook and Class Supply List Details)
- Graduate and Alumni Events (e.g. Organizing Class Reunions)
Navigation
Can't Find What You Are Looking For?
Rankings
Nearby Cities
Sponsored Links
K-12 Articles
Bullycide: What is It and How Can It Be Prevented?
Disclaimer: This article expresses my opinion that has been formed by personal experience and...
Halloween Safety Tips
Ghosts and witches sit beside mistletoe and tinsel on store shelves. Orange and black deck the...
Middle School Homework and Study Habits
The report cards came home and you're disappointed with your child's scores. You know he has the...


