Collins Elementary School
Rating
Not Available
Not Available

5 out of 5 | 2 Reviews
Find Old Friends From Collins Elementary School
Use the form below to search for alumni from Collins Elementary School.
School Description
School Summary and Highlights
- Enrolls 405 elementary school students from grades KG-6
- Ranks 3548th out of 5,423 elementary schools in CA.
- 2010 Overall School AYP Met Status: No
Additional Contact Information
- Mailing Address: 1224 Pinole Valley Rd., Pinole, CA 94564
School District Details
- West Contra Costa Unified School District
- Per-Pupil Spending: $9,943
- Graduation Rate: 61.2%
- Dropout Rate: 5.6%
- Students Per Teacher: 20.9
- Enrolled Students: 29,881
Faculty Details and Student Enrollment
Students and Faculty
- Total Students Enrolled: 405
- Total Full Time "Equivalent" Teachers: 20.0
- Average Student-To-Teacher Ratio: 20.3
Students Gender Breakdown
- Males: 197 (48.6%)
- Females: 208 (51.4%)
Free Lunch Student Eligibility Breakdown
- Eligible for Reduced Lunch: 59 (14.6%)
- Eligible for Free Lunch: 162 (40.0%)
- Eligible for Either Reduced or Free Lunch: 221 (54.6%)
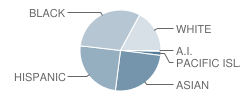
Student Enrollment Distribution by Race / Ethnicity
| Number | Percent | |
|---|---|---|
| American Indian | 2 | 0.5% |
| Black | 125 | 30.9% |
| Asian | 101 | 24.9% |
| Hispanic | 100 | 24.7% |
| White | 69 | 17.0% |
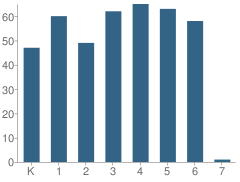
Number of Students Per Grade
| Number | Percent | |
|---|---|---|
| Kindergarten | 47 | 11.6% |
| 1st Grade | 60 | 14.8% |
| 2nd Grade | 49 | 12.1% |
| 3rd Grade | 62 | 15.3% |
| 4th Grade | 65 | 16.0% |
| 5th Grade | 63 | 15.6% |
| 6th Grade | 58 | 14.3% |
| 7th Grade | 1 | 0.2% |
Teacher Education Background (2009)
Percent With Master's Degree
School:
4.2%
District:
25.4%
Percent With Bachelor's Degree
School:
16.7%
District:
11.2%
Teacher Credentials & Experience (2009)
Percent of Teachers With Credentials: 87.0%
Number of Certificated Staff: 24.0
Average Number of Years of Teacher Experience: 14.3
Average Age
School:
46.5
District:
49.4
Source: CA Department of Education, Source: NCES 2009-2010
School Ratings and Reviews
Overall Rating: 5

5 out of 5 | 2 Reviews
The Overall Rating is the school's average rating from parents, students, school faculty and staff. The highest rating is five apples and the lowest is one apple.
Share Your Review About This School
2 reviews for Collins Elementary School
- Reviewed by Parent/Guardian on September 28, 2008
- Rating:
 (5 / 5) Flag as inappropriate
 - My family and I am grateful to the new principal for the compationate, firm and consistent guidance she gives to our children. I am the first to admit that my children are no angels. But the way that our current principal disciplines the students with care and good intent is working. For the first time, my children are happy to go to school and they are doing better than ever before! I am in full support of her compassionate, yet firm leadership style that the students are responding to. She bringings a breath of fresh air to Collins. The disgruntled teacher who is slandering her ought to feel ashamed for blaming her for his inability to manage his class. It is that type of disrespectful, unprofessional conduct that will be the downfall of his career and the education of his students. I wish the new leadership success despite such insubordination.
- Reviewed by Community Member on September 12, 2008
- Rating: (5 / 5) Flag as inappropriate
- I am absolutely appalled at the new principal's lack of professional behavior and expertise - the children I know who attend Collins say she never disciplines the students who are sent to her office and thinks hugs will cure the kids with deeper issues. Instead of learning through consequence, said students are coached by her to explain their behavior to their teachers with excuses like not knowing the material as a reason for bad behavior. Recently students were physically striking one another in her presence and she told the teacher to ignore them! Naturally my friend will be transferring her children as soon as possible.
School Map and Similar Schools Nearby
Click to Activate Map of Nearby School Campuses
Private
Public
This School
Similar Schools Nearby
| Stewart Elementary School KG-8 | 525 Students | 0.8 miles away |  2.5 out of 5 | |
| Ohlone Elementary School KG-6 | 441 Students | 0.9 miles away |  4.5 out of 5 | |
| Shannon Elementary School KG-6 | 308 Students | 1.3 miles away |  5 out of 5 | |
| Tara Hills Elementary School KG-6 | 533 Students | 1.5 miles away | Not Yet Rated | |
| Ellerhorst Elementary School KG-6 | 435 Students | 1.5 miles away | Not Yet Rated | |
| Murphy Elementary School KG-6 | 445 Students | 1.8 miles away |  1 out of 5 | |
| Lupine Hills Elementary School KG-6 | 424 Students | 1.9 miles away | Not Yet Rated | |
| Valley View Elementary School KG-6 | 387 Students | 2.0 miles away | Not Yet Rated | |
| Rodeo Hills Elementary School KG-5 | 739 Students | 2.2 miles away | 5 out of 5 | |
| Sheldon Elementary School KG-6 | 345 Students | 2.4 miles away | Not Yet Rated | |
Compare This School To Nearby Schools ->
School Community Forum

Join a discussion about Collins Elementary School and talk to others in the community including students, parents, teachers, and administrators.
Popular Discussion Topics
- Admissions and Registration Questions (e.g. Dress Code and Discipline Policy)
- School Calendar and Upcoming Events (e.g. Graduation)
- After School Programs, Extracurricular Activities, and Athletics (e.g. Football)
- News and Announcements (e.g. Yearbook and Class Supply List Details)
- Graduate and Alumni Events (e.g. Organizing Class Reunions)
Navigation
Can't Find What You Are Looking For?
Rankings
Nearby Cities
Sponsored Links
K-12 Articles

Imho
I was watching Headline News’s news ticker when I read something that made me LOL. The ticker said...
I was watching Headline News’s news ticker when I read something that made me LOL. The ticker said...

Special Needs Education: Your Child, Your Rights
Many children today have special needs that make it difficult for them to learn. It’s imperative...
Many children today have special needs that make it difficult for them to learn. It’s imperative...

Promoting Childhood Literacy
The number of American adults who are illiterate is astounding. People who lack the ability to read...
The number of American adults who are illiterate is astounding. People who lack the ability to read...