Hercules High School
Rating
Not Available
Not Available

4 out of 5 | 2 Reviews
Find Old Friends From Hercules High School
Use the form below to search for alumni from Hercules High School.
School Description
School Summary and Highlights
- Enrolls 1,008 high school students from grades 9-12
- Ranks 933rd out of 1,197 high schools in CA.
- 2010 Overall School AYP Met Status: No
Additional Contact Information
- Mailing Address: 1900 Refugio Valley Rd., Hercules, CA 94547
School District Details
- West Contra Costa Unified School District
- Per-Pupil Spending: $9,943
- Graduation Rate: 61.2%
- Dropout Rate: 5.6%
- Students Per Teacher: 20.9
- Enrolled Students: 29,881
Faculty Details and Student Enrollment
Students and Faculty
- Total Students Enrolled: 1,008
- Total Full Time "Equivalent" Teachers: 49.8
- Average Student-To-Teacher Ratio: 20.2
Students Gender Breakdown
- Males: 526 (52.2%)
- Females: 482 (47.8%)
Free Lunch Student Eligibility Breakdown
- Eligible for Reduced Lunch: 88 (8.7%)
- Eligible for Free Lunch: 238 (23.6%)
- Eligible for Either Reduced or Free Lunch: 326 (32.3%)
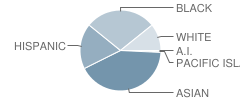
Student Enrollment Distribution by Race / Ethnicity
| Number | Percent | |
|---|---|---|
| American Indian | 4 | 0.4% |
| Black | 285 | 28.3% |
| Asian | 420 | 41.7% |
| Hispanic | 183 | 18.2% |
| White | 109 | 10.8% |
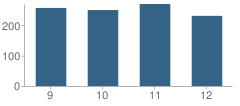
Number of Students Per Grade
| Number | Percent | |
|---|---|---|
| 9th Grade | 257 | 25.5% |
| 10th Grade | 250 | 24.8% |
| 11th Grade | 270 | 26.8% |
| 12th Grade | 231 | 22.9% |
Graduates Information (2010)
Graduation Rate
School:
82.1%
District:
74.2%
State:
78.6%
Teacher Education Background (2009)
Percent With Master's Degree
School:
11.5%
District:
25.4%
Percent With Bachelor's Degree
School:
24.6%
District:
11.2%
Teacher Credentials & Experience (2009)
Percent of Teachers With Emergency Credentials: 7.7%
Percent of Teachers With Credentials: 82.7%
Number of Certificated Staff: 61.0
Average Number of Years of Teacher Experience: 12.3
Average Age
School:
45.6
District:
49.4
Source: CA Department of Education, Source: NCES 2009-2010
School Ratings and Reviews
Overall Rating: 4

4 out of 5 | 2 Reviews
The Overall Rating is the school's average rating from parents, students, school faculty and staff. The highest rating is five apples and the lowest is one apple.
Share Your Review About This School
2 reviews for Hercules High School
- Reviewed by Student on April 30, 2010
- Rating:
 (3 / 5) Flag as inappropriate
 - Overall, I think a student's experience is what they make it. I honestly cannot say that Hercules High is a great school - or that I am proud to be a Titan, but I worked with what I had. I am one of those higher testing students, but that is because I have had enough initiative to take advantage of the few resources available. A FEW of my teachers seemed to care if I passed or failed, and I worked most closely with those teachers. Yes drugs and bullies certainly have their place, but it is possible to escape them and their influence. I wouldn't say any one thing dominates at Hercules High. Administrators will say that education does, most teachers will be unavailable or unable to answer, and the student's response depends entirely on the student and what they put into the school.
- Reviewed by Parent/Guardian on October 28, 2008
- Rating:
 (5 / 5) Flag as inappropriate
 - whoever wrote this review was obliously unlucky. This school is a really great school. If you look at the test scores, you will see that they have some of the highest in the county. Fights are a rarity, drugs, like anywhere else, are a problem, but dont run the school, and parties, ha. There are occasional dances celebrating occasions but they are rare as well.
School Map and Similar Schools Nearby
Click to Activate Map of Nearby School Campuses
Private
Public
This School
Similar Schools Nearby
| Pinole Valley High School 9-12 | 1,622 Students | 2.0 miles away | Not Yet Rated | |
| De Anza High School 9-12 | 907 Students | 2.9 miles away |  5 out of 5 | |
| Crespi Junior High School 7-8 | 581 Students | 3.2 miles away | Not Yet Rated | |
| John Swett High School 9-12 | 524 Students | 4.1 miles away | Not Yet Rated | |
| Middle College High School 9-12 | 311 Students | 5.4 miles away |  3.5 out of 5 | |
| Richmond High School 9-12 | 1,671 Students | 6.0 miles away | Not Yet Rated | |
| Benicia High School 9-12 | 1,671 Students | 6.1 miles away | Not Yet Rated | |
| Portola Junior High School 6-8 | 599 Students | 6.4 miles away | 5 out of 5 | |
| Alhambra High School 9-12 | 1,280 Students | 6.4 miles away | 5 out of 5 | |
| Martinez Junior High School 6-8 | 918 Students | 6.6 miles away | Not Yet Rated | |
Compare This School To Nearby Schools ->
School Community Forum

Join a discussion about Hercules High School and talk to others in the community including students, parents, teachers, and administrators.
Popular Discussion Topics
- Admissions and Registration Questions (e.g. Dress Code and Discipline Policy)
- School Calendar and Upcoming Events (e.g. Graduation)
- After School Programs, Extracurricular Activities, and Athletics (e.g. Football)
- News and Announcements (e.g. Yearbook and Class Supply List Details)
- Graduate and Alumni Events (e.g. Organizing Class Reunions)
Navigation
Can't Find What You Are Looking For?
Rankings
Nearby Cities
Sponsored Links
K-12 Articles

Attend Your Teen's Holiday Parties
Christmas and New Years are coming, and with them Christmas and New Years Eve parties. At many of...
Christmas and New Years are coming, and with them Christmas and New Years Eve parties. At many of...

Break the Cycle: Teen Dating Violence and Prevention Week
February 5 through 9 was "National Teen Dating Violence Awareness and Prevention Week"....
February 5 through 9 was "National Teen Dating Violence Awareness and Prevention Week"....

Middle School Homework and Study Habits
The report cards came home and you're disappointed with your child's scores. You know he has the...
The report cards came home and you're disappointed with your child's scores. You know he has the...