Rim of the World High School
Rating
Not Available
Not Available

3.5 out of 5 | 7 Reviews
Find Old Friends From Rim of the World High School
Use the form below to search for alumni from Rim of the World High School.
School Description
School Summary and Highlights
- Enrolls 1,402 high school students from grades 9-12
- Ranks 613th out of 1,197 high schools in CA.
- 2010 Overall School AYP Met Status: No
Additional Contact Information
- Mailing Address: PO Box 430, Lake Arrowhead, CA 92352
School District Details
- Rim of the World Unified School District
- Per-Pupil Spending: $7,943
- Graduation Rate: 63.4%
- Dropout Rate: 5.2%
- Students Per Teacher: 23.7
- Enrolled Students: 4,586
Faculty Details and Student Enrollment
Students and Faculty
- Total Students Enrolled: 1,402
- Total Full Time "Equivalent" Teachers: 49.8
- Average Student-To-Teacher Ratio: 28.2
Students Gender Breakdown
- Males: 733 (52.3%)
- Females: 669 (47.7%)
Free Lunch Student Eligibility Breakdown
- Eligible for Reduced Lunch: 76 (5.4%)
- Eligible for Free Lunch: 372 (26.5%)
- Eligible for Either Reduced or Free Lunch: 448 (32.0%)
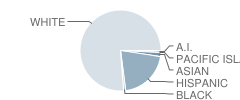
Student Enrollment Distribution by Race / Ethnicity
| Number | Percent | |
|---|---|---|
| American Indian | 10 | 0.7% |
| Black | 13 | 0.9% |
| Asian | 23 | 1.6% |
| Hispanic | 281 | 20.0% |
| White | 1,042 | 74.3% |
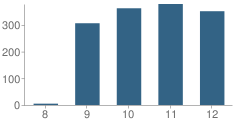
Number of Students Per Grade
| Number | Percent | |
|---|---|---|
| 8th Grade | 5 | 0.4% |
| 9th Grade | 306 | 21.8% |
| 10th Grade | 362 | 25.8% |
| 11th Grade | 378 | 27.0% |
| 12th Grade | 351 | 25.0% |
Graduates Information (2010)
Graduation Rate
School:
93.2%
District:
88.2%
State:
78.6%
Teacher Education Background (2009)
Percent With Ph.D.
School:
1.5%
District:
11.1%
Percent With Master's Degree
School:
19.4%
District:
33.3%
Percent With Bachelor's Degree
School:
9.0%
District:
11.1%
Teacher Credentials & Experience (2009)
Percent of Teachers With Credentials: 98.2%
Number of Certificated Staff: 67.0
Average Number of Years of Teacher Experience: 15.9
Average Age
School:
46.5
District:
51.9
Source: CA Department of Education, Source: NCES 2009-2010
School Ratings and Reviews
Overall Rating: 3.5

3.5 out of 5 | 7 Reviews
The Overall Rating is the school's average rating from parents, students, school faculty and staff. The highest rating is five apples and the lowest is one apple.
Share Your Review About This School
7 reviews for Rim of the World High School
- Reviewed by Community Member on September 04, 2010
- Rating:
 (5 / 5) Flag as inappropriate
 - Great student body, great staff, great school
- Reviewed by Parent/Guardian on April 22, 2010
- Rating:
 (1 / 5) Flag as inappropriate
 - This school's performance is awful, the teachers do NOT care about the children's education, they freely allow bullying. I do not recommend (I have been associated with this school for 10 years).
- Reviewed by Parent/Guardian on February 23, 2010
- Rating:
 (3 / 5) Flag as inappropriate
 - i go to RIM and i will graduate in 2011. I must say that it is an OKAY school. not the best nor the worst but some teachers are very helpful and some arnt but i believe its the teachers different styles of teaching and sometimes some might not be as intresting but regardless i think you can do well in this school its like every other public high school....and everyone should have their valid opinion.
- Reviewed by Former Student on December 02, 2009
- Rating: (5 / 5) Flag as inappropriate
- i went to this school, graduated in 1994... not sure how the school is now a days especially with all the cut back teachers have been facing, but i can say the teacher up there is great, they take pride in students achievements, so to all of those who have helped me get to were i am today thanks, to the former students i know you don't like school and it might seem like a horrible place but learn as much as you can cause when you get out into the real world you can use what they thought you and you shall succeed...thanks again teachers of class 1994...sincerly yours gunnerr
- Reviewed by Parent/Guardian on February 09, 2009
- Rating: (1 / 5) Flag as inappropriate
- I think the high school is a very bad school. The teachers do not care about the kids, especially if your child has a IEP!
- Reviewed by Parent/Guardian on September 15, 2008
- Rating: (5 / 5) Flag as inappropriate
- great facilities, commutable by public transportation
- Reviewed by Parent/Guardian on July 22, 2008
- Rating:
 (4 / 5) Flag as inappropriate
 - As with all public schools in California, schools are second to prison. It should also be noted that their hands are tied by state budgets. The state pays prison guards more than the teachers. A prison guard requires a high school diploma and a teacher requires 6 years of college (4 years for a BA and 2 for the credential)
Read All 7 Reviews ->
School Map and Similar Schools Nearby
Click to Activate Map of Nearby School Campuses
Private
Public
This School
Similar Schools Nearby
| Cajon High School 9-12 | 2,913 Students | 6.9 miles away |  4.5 out of 5 | |
| San Gorgonio High School 9-12 | 3,177 Students | 7.3 miles away |  2.5 out of 5 | |
| Pacific High School 9-12 | 2,330 Students | 7.8 miles away |  4 out of 5 | |
| San Bernardino High School 9-12 | 2,456 Students | 8.5 miles away | 4 out of 5 | |
| Citrus Valley High School 9-12 | 1,037 Students | 10.5 miles away | Not Yet Rated | - |
| Arroyo Valley High School 9-12 | 3,007 Students | 10.6 miles away |  5 out of 5 | |
| Richardson Preparatory High School 6-8 | 612 Students | 11.1 miles away | 5 out of 5 | |
| Redlands High School 9-12 | 3,110 Students | 12.3 miles away | Not Yet Rated | |
| Wilmer Amina Carter High School 9-12 | 2,563 Students | 12.5 miles away | 2.5 out of 5 | |
| Redlands East Valley High School 9-12 | 3,094 Students | 12.6 miles away | 5 out of 5 | |
Compare This School To Nearby Schools ->
School Community Forum

Join a discussion about Rim of the World High School and talk to others in the community including students, parents, teachers, and administrators.
Popular Discussion Topics
- Admissions and Registration Questions (e.g. Dress Code and Discipline Policy)
- School Calendar and Upcoming Events (e.g. Graduation)
- After School Programs, Extracurricular Activities, and Athletics (e.g. Football)
- News and Announcements (e.g. Yearbook and Class Supply List Details)
- Graduate and Alumni Events (e.g. Organizing Class Reunions)
Navigation
Can't Find What You Are Looking For?
Rankings
Nearby Cities
Sponsored Links
K-12 Articles

Preparing Your Child for the First Day of School
It seems like school was just dismissed for the summer, yet here we are facing another year of back...
It seems like school was just dismissed for the summer, yet here we are facing another year of back...

Tips for Easing Your Child's Back to School Stress
Do you remember the roller coaster of emotions that you experienced as a child when the day for...
Do you remember the roller coaster of emotions that you experienced as a child when the day for...

Helping Your Child Leave the Nest
It's all come down to this: Eighteen years of good times and bad, and now your baby bird is ready...
It's all come down to this: Eighteen years of good times and bad, and now your baby bird is ready...