Monument Middle School
Rating
Not Available
Not Available

No Reviews Yet
Find Old Friends From Monument Middle School
Use the form below to search for alumni from Monument Middle School.
School Description
School Summary and Highlights
- Enrolls 97 middle school students from grades 6-8
- Ranks 810th out of 2,050 middle schools in CA.
- 2010 Overall School AYP Met Status: Yes
Additional Contact Information
- Mailing Address: 95 Center St., Rio Dell, CA 95562
School Operational Details
- Title I EligibleAll students of this school are eligible for participation in authorized programs.
School District Details
- Rio Dell Elementary School District
- Per-Pupil Spending: $10,227
- Students Per Teacher: 24.2
- Enrolled Students: 315
Faculty Details and Student Enrollment
Students and Faculty
- Total Students Enrolled: 97
- Total Full Time "Equivalent" Teachers: 3.0
- Average Student-To-Teacher Ratio: 32.3
Students Gender Breakdown
- Males: 51 (52.6%)
- Females: 46 (47.4%)
Free Lunch Student Eligibility Breakdown
- Eligible for Reduced Lunch: 15 (15.5%)
- Eligible for Free Lunch: 57 (58.8%)
- Eligible for Either Reduced or Free Lunch: 72 (74.2%)
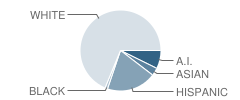
Student Enrollment Distribution by Race / Ethnicity
| Number | Percent | |
|---|---|---|
| American Indian | 7 | 7.2% |
| Black | 1 | 1.0% |
| Asian | 3 | 3.1% |
| Hispanic | 19 | 19.6% |
| White | 66 | 68.0% |
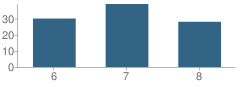
Number of Students Per Grade
| Number | Percent | |
|---|---|---|
| 6th Grade | 30 | 30.9% |
| 7th Grade | 39 | 40.2% |
| 8th Grade | 28 | 28.9% |
Teacher Credentials & Experience (2009)
Percent of Teachers With Credentials: 100.0%
Number of Certificated Staff: 5.0
Average Number of Years of Teacher Experience: 12.6
Average Age
School:
43.6
District:
41.7
Source: CA Department of Education, Source: NCES 2009-2010
School Ratings and Reviews
Be The First To Review Monument Middle School!
School Map and Similar Schools Nearby
Click to Activate Map of Nearby School Campuses
Private
Public
This School
Similar Schools Nearby
| Eagle Prairie Elementary School KG-6 | 218 Students | 0 miles away | Not Yet Rated | |
| Stanwood A. Murphy Elementary School KG-8 | 216 Students | 1.3 miles away |  5 out of 5 | |
| Hydesville Elementary School KG-8 | 155 Students | 3.7 miles away | Not Yet Rated | |
| Cuddeback Elementary School KG-8 | 117 Students | 4.1 miles away | Not Yet Rated | |
| Toddy Thomas Elementary School 5-8 | 297 Students | 5.0 miles away | Not Yet Rated | |
| South Fortuna Elementary School KG-10 | 472 Students | 6.3 miles away | Not Yet Rated | |
| Fortuna Middle School 5-8 | 239 Students | 7.2 miles away | Not Yet Rated | |
| Ferndale Elementary School KG-8 | 330 Students | 10.0 miles away | Not Yet Rated | |
| Loleta Elementary School KG-8 | 114 Students | 11.3 miles away | Not Yet Rated | |
| Bridgeville Elementary School KG-8 | 37 Students | 15.1 miles away | Not Yet Rated | - |
Compare This School To Nearby Schools ->
Navigation
Can't Find What You Are Looking For?
Rankings
Nearby Cities
Sponsored Links
K-12 Articles

The Pros and Cons of Seat Belts in School Buses
Recently the news has been full of school bus accidents where children have been seriously injured...
Recently the news has been full of school bus accidents where children have been seriously injured...

Helping Young Children with Printing and Cursive Writing
Is your child experiencing difficulty printing or writing? Is he unable to print or write legibly,...
Is your child experiencing difficulty printing or writing? Is he unable to print or write legibly,...

Homework Tips: Taking the Work out of Homework
Kids hate homework. It seems that almost every night of the week they are overloaded with...
Kids hate homework. It seems that almost every night of the week they are overloaded with...