Falkville High School
Rating
Not Available
Not Available

No Reviews Yet
Find Old Friends From Falkville High School
Use the form below to search for alumni from Falkville High School.
School Description
School Summary and Highlights
- Enrolls 411 middle and high school students from grades 6-12
- Ranks 75th out of 357 high schools in AL.
Additional Contact Information
- Mailing Address: P O Box 388, Falkville, AL 35622
- Principal or Admin: Mrs Sue Edna Wood
- Fax: (256) 784-6255
- Website: morgank12.org
School Operational Details
- Shared Time School
School District Details
- Morgan County School District
- Per-Pupil Spending: $9,385
- Graduation Rate: 70.9%
- Dropout Rate: 3.6%
- Students Per Teacher: 13.4
- Enrolled Students: 7,880
Faculty Details and Student Enrollment
Students and Faculty
- Total Students Enrolled: 411
- Total Full Time "Equivalent" Teachers: 30.6
- Average Student-To-Teacher Ratio: 13.5
Students Gender Breakdown
- Males: 202 (49.1%)
- Females: 209 (50.9%)
Free Lunch Student Eligibility Breakdown
- Eligible for Reduced Lunch: 52 (12.7%)
- Eligible for Free Lunch: 154 (37.5%)
- Eligible for Either Reduced or Free Lunch: 206 (50.1%)
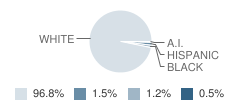
Student Enrollment Distribution by Race / Ethnicity
| Number | Percent | |
|---|---|---|
| American Indian | 2 | 0.5% |
| Black | 5 | 1.2% |
| Asian | - | - |
| Hispanic | 6 | 1.5% |
| White | 398 | 96.8% |
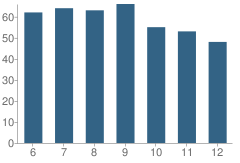
Number of Students Per Grade
| Number | Percent | |
|---|---|---|
| 6th Grade | 62 | 15.1% |
| 7th Grade | 64 | 15.6% |
| 8th Grade | 63 | 15.3% |
| 9th Grade | 66 | 16.1% |
| 10th Grade | 55 | 13.4% |
| 11th Grade | 53 | 12.9% |
| 12th Grade | 48 | 11.7% |
Source: AL Department of Education, Source: NCES 2009-2010
School Ratings and Reviews
Be The First To Review Falkville High School!
School Map and Similar Schools Nearby
Click to Activate Map of Nearby School Campuses
Private
Public
This School
Similar Schools Nearby
| Hartselle Junior High School 6-8 | 749 Students | 4.7 miles away | Not Yet Rated | |
| Hartselle High School 9-12 | 957 Students | 6.1 miles away | Not Yet Rated | |
| Vinemont High School 9-12 | 354 Students | 9.0 miles away | Not Yet Rated | |
| West Point High School 9-12 | 602 Students | 9.2 miles away |  5 out of 5 | |
| Danville High School 9-12 | 391 Students | 10.8 miles away | Not Yet Rated | |
| Albert P Brewer High School 9-12 | 895 Students | 12.4 miles away | Not Yet Rated | |
| Cullman High School 9-12 | 934 Students | 12.9 miles away | Not Yet Rated | |
| Priceville Junior High School 6-8 | 355 Students | 14.1 miles away | Not Yet Rated | |
| Fairview High School 9-12 | 508 Students | 15.0 miles away | Not Yet Rated | |
| Speake High School KG-8 | 283 Students | 15.2 miles away | Not Yet Rated | |
Compare This School To Nearby Schools ->
School Community Forum

Join a discussion about Falkville High School and talk to others in the community including students, parents, teachers, and administrators.
Popular Discussion Topics
- Admissions and Registration Questions (e.g. Dress Code and Discipline Policy)
- School Calendar and Upcoming Events (e.g. Graduation)
- After School Programs, Extracurricular Activities, and Athletics (e.g. Football)
- News and Announcements (e.g. Yearbook and Class Supply List Details)
- Graduate and Alumni Events (e.g. Organizing Class Reunions)
Navigation
Can't Find What You Are Looking For?
Nearby Cities
Sponsored Links
K-12 Articles

The Impact on Adopted Children at School
Children who are adopted can be affected both academically and socially at school. Many times...
Children who are adopted can be affected both academically and socially at school. Many times...

School's out for Recess
Recess used to be the best part of school; that and lunch. But today, a shocking two-thirds of...
Recess used to be the best part of school; that and lunch. But today, a shocking two-thirds of...

Parent and Family Involvement in School
When visiting my grandson's school, I often hear administrators and teachers complaining that not...
When visiting my grandson's school, I often hear administrators and teachers complaining that not...