John A. Rowland High School
2000 South Otterbein St, Rowland Heights, CA 91748 | (626) 965-3448
- Grades: 9-12
- Student Enrollment: 2,310

No Reviews Yet
Find Old Friends From John A. Rowland High School
Use the form below to search for alumni from John A. Rowland High School.
School Description
School Summary and Highlights
- Enrolls 2,310 high school students from grades 9-12
- Ranks 235th out of 1,197 high schools in CA.
- 2010 Overall School AYP Met Status: No
Additional Contact Information
- Mailing Address: 2000 South Otterbein St., Rowland Heights, CA 91748
School District Details
- Rowland Unified School District
- Per-Pupil Spending: $8,914
- Graduation Rate: 66.9%
- Dropout Rate: 2.2%
- Students Per Teacher: 22.5
- Enrolled Students: 15,971
Faculty Details and Student Enrollment
Students and Faculty
- Total Students Enrolled: 2,310
- Total Full Time "Equivalent" Teachers: 85.4
- Average Student-To-Teacher Ratio: 27.1
Students Gender Breakdown
- Males: 1,163 (50.3%)
- Females: 1,147 (49.7%)
Free Lunch Student Eligibility Breakdown
- Eligible for Reduced Lunch: 329 (14.2%)
- Eligible for Free Lunch: 577 (25.0%)
- Eligible for Either Reduced or Free Lunch: 906 (39.2%)
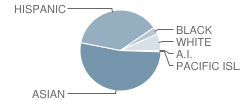
Student Enrollment Distribution by Race / Ethnicity

| Number | Percent | |
|---|---|---|
| American Indian | 1 | 0.04% |
| Black | 66 | 2.9% |
| Asian | 1,196 | 51.8% |
| Hispanic | 851 | 36.8% |
| White | 152 | 6.6% |
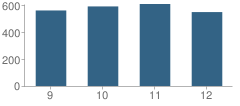
Number of Students Per Grade

| Number | Percent | |
|---|---|---|
| 9th Grade | 561 | 24.3% |
| 10th Grade | 591 | 25.6% |
| 11th Grade | 609 | 26.4% |
| 12th Grade | 549 | 23.8% |
Graduates Information (2010)
Graduation Rate
School:
95.7%
District:
90.3%
State:
78.6%
Teacher Education Background (2009)
Percent With Ph.D.
School:
2.0%
District:
6.1%
Percent With Master's Degree
School:
8.8%
District:
14.3%
Percent With Bachelor's Degree
School:
9.8%
District:
14.3%
Teacher Credentials & Experience (2009)
Percent of Teachers With Emergency Credentials: 4.3%
Percent of Teachers With Credentials: 96.7%
Number of Certificated Staff: 102.0
Average Number of Years of Teacher Experience: 15.9
Average Age
School:
43.9
District:
47.0
Source: CA Department of Education, Source: NCES 2009-2010
School Ratings and Reviews
Be The First To Review John A. Rowland High School!
Sponsored Links
Test Scores and Performance Information
Overall School Rating
How is this determined?
The overall school rating shows that John A. Rowland High School performed on average better than many other schools across the state on CST state exams in the following subjects:
- CST Algebra I
- CST Algebra II
- CST Biology
- CST Chemistry
- CST Earth Science
- CST English-Language Arts
- CST Geometry
- CST Integrated Math 1
- CST Physics
- CST Science
- CST Summative High School Math
- CST U.S. History
- CST World History
AYP Results (2010)
Overall AYP Met: No
ELA AYP Met: No
Math AYP Met: No
ACT Exam Results (2009)
Percent of Students Taking ACT Exam: 7.7%
Average Combined Score: 24.3
Percent Scoring At or Above 21: 78.7%
SAT Exam Results (2009)
Percent of Students Taking SAT Exam: 41.4%
Average Combined Score: 1,656.5
Critical Reading Average: 528.7
Math Average: 593.6
Writing Average: 534.2
Percent Scoring At or Above 1500: 68.5%
CST - Test Proficiency by Grade and Subject
Grade 9 - % of students at or above proficiency
| School | District | State | |
|---|---|---|---|
| CST Algebra I Test | |||
| 2010 | 9.0% | 16.0% | 22.0% |
| 2009 | 10.0% | 10.0% | 21.0% |
| 2008 | 7.0% | 5.0% | 18.0% |
| CST Algebra II Test | |||
| 2010 | 56.0% | 54.0% | 69.0% |
| 2009 | 77.0% | 71.0% | 65.0% |
| 2008 | 70.0% | 66.0% | 66.0% |
| CST Biology Test | |||
| 2010 | 95.0% | 92.0% | 55.0% |
| 2009 | 91.0% | 79.0% | 51.0% |
| 2008 | 95.0% | 87.0% | 52.0% |
| CST Earth Science Test | |||
| 2010 | 56.0% | 40.0% | 35.0% |
| 2009 | 45.0% | 29.0% | 29.0% |
| 2008 | 54.0% | 36.0% | 31.0% |
| CST English-Language Arts Test | |||
| 2010 | 71.0% | 61.0% | 54.0% |
| 2009 | 64.0% | 53.0% | 50.0% |
| 2008 | 63.0% | 56.0% | 49.0% |
| CST Geometry Test | |||
| 2010 | 42.0% | 36.0% | 46.0% |
| 2009 | 30.0% | 23.0% | 47.0% |
| 2008 | 39.0% | 25.0% | 43.0% |
| CST Integrated Math 1 Test | |||
| 2010 | 17.0% | 17.0% | 28.0% |
| 2009 | 23.0% | 22.0% | 26.0% |
| 2008 | 2.0% | 2.0% | 15.0% |
| CST Summative High School Math Test | |||
| 2010 | 94.0% | 94.0% | 87.0% |
| 2009 | 95.0% | 93.0% | 80.0% |
| 2008 | 94.0% | 93.0% | 79.0% |
| CST World History Test | |||
| 2010 | 94.0% | 89.0% | 45.0% |
| 2009 | 90.0% | 82.0% | 41.0% |
| 2008 | 82.0% | 75.0% | 36.0% |
Grade 10 - % of students at or above proficiency
| School | District | State | |
|---|---|---|---|
| CST Algebra I Test | |||
| 2010 | 19.0% | 13.0% | 12.0% |
| 2009 | 5.0% | 5.0% | 11.0% |
| 2008 | 2.0% | 3.0% | 9.0% |
| CST Algebra II Test | |||
| 2010 | 36.0% | 34.0% | 40.0% |
| 2009 | 41.0% | 35.0% | 37.0% |
| 2008 | 38.0% | 27.0% | 36.0% |
| CST Biology Test | |||
| 2010 | 41.0% | 32.0% | 38.0% |
| 2009 | 48.0% | 35.0% | 34.0% |
| 2008 | 42.0% | 32.0% | 35.0% |
| CST Chemistry Test | |||
| 2010 | 80.0% | 63.0% | 47.0% |
| 2009 | 72.0% | 60.0% | 44.0% |
| 2008 | 68.0% | 47.0% | 41.0% |
| CST Earth Science Test | |||
| 2010 | 35.0% | 27.0% | 29.0% |
| 2009 | 26.0% | 22.0% | 23.0% |
| 2008 | 26.0% | 19.0% | 23.0% |
| CST English-Language Arts Test | |||
| 2010 | 58.0% | 48.0% | 45.0% |
| 2009 | 57.0% | 47.0% | 44.0% |
| 2008 | 53.0% | 42.0% | 41.0% |
| CST Geometry Test | |||
| 2010 | 21.0% | 10.0% | 14.0% |
| 2009 | 17.0% | 9.0% | 14.0% |
| 2008 | 24.0% | 9.0% | 12.0% |
| CST Integrated Math 1 Test | |||
| 2010 | 4.0% | 4.0% | 11.0% |
| 2009 | 1.0% | 1.0% | 9.0% |
| 2008 | 6.0% | 4.0% | 10.0% |
| CST Science Test | |||
| 2010 | 62.0% | 51.0% | 46.0% |
| 2009 | 58.0% | 48.0% | 44.0% |
| 2008 | 49.0% | 38.0% | 40.0% |
| CST Summative High School Math Test | |||
| 2010 | 89.0% | 85.0% | 75.0% |
| 2009 | 84.0% | 76.0% | 71.0% |
| 2008 | 78.0% | 74.0% | 68.0% |
| CST World History Test | |||
| 2010 | 46.0% | 31.0% | 42.0% |
| 2009 | 41.0% | 31.0% | 38.0% |
| 2008 | 31.0% | 20.0% | 33.0% |
Grade 11 - % of students at or above proficiency
| School | District | State | |
|---|---|---|---|
| CST Algebra I Test | |||
| 2010 | 22.0% | 10.0% | 8.0% |
| 2009 | 7.0% | 5.0% | 8.0% |
| 2008 | 4.0% | 5.0% | 5.0% |
| CST Algebra II Test | |||
| 2010 | 28.0% | 22.0% | 14.0% |
| 2009 | 24.0% | 17.0% | 12.0% |
| 2008 | 32.0% | 20.0% | 11.0% |
| CST Biology Test | |||
| 2010 | 46.0% | 49.0% | 46.0% |
| 2009 | 59.0% | 42.0% | 41.0% |
| 2008 | 64.0% | 51.0% | 39.0% |
| CST Chemistry Test | |||
| 2010 | 43.0% | 30.0% | 30.0% |
| 2009 | 32.0% | 18.0% | 27.0% |
| 2008 | 21.0% | 12.0% | 25.0% |
| CST Earth Science Test | |||
| 2010 | 15.0% | 19.0% | 32.0% |
| 2009 | 24.0% | 18.0% | 26.0% |
| 2008 | 21.0% | 18.0% | 28.0% |
| CST English-Language Arts Test | |||
| 2010 | 56.0% | 45.0% | 42.0% |
| 2009 | 51.0% | 40.0% | 40.0% |
| 2008 | 49.0% | 38.0% | 37.0% |
| CST Geometry Test | |||
| 2010 | 15.0% | 10.0% | 6.0% |
| 2009 | 8.0% | 4.0% | 7.0% |
| 2008 | 12.0% | 4.0% | 6.0% |
| CST Integrated Math 1 Test | |||
| 2010 | 6.0% | 8.0% | 11.0% |
| 2009 | 5.0% | 4.0% | 9.0% |
| 2008 | 2.0% | 4.0% | 9.0% |
| CST Physics Test | |||
| 2010 | 92.0% | 91.0% | 53.0% |
| 2009 | 85.0% | 75.0% | 50.0% |
| 2008 | 83.0% | 78.0% | 47.0% |
| CST Summative High School Math Test | |||
| 2010 | 74.0% | 63.0% | 50.0% |
| 2009 | 72.0% | 54.0% | 47.0% |
| 2008 | 67.0% | 55.0% | 43.0% |
| CST U.S. History Test | |||
| 2010 | 62.0% | 49.0% | 45.0% |
| 2009 | 51.0% | 41.0% | 44.0% |
| 2008 | 55.0% | 39.0% | 38.0% |
End of Course - % of students at or above proficiency
| School | District | State | |
|---|---|---|---|
| CST Algebra I Test | |||
| 2010 | 12.0% | 36.0% | 31.0% |
| 2009 | 9.0% | 32.0% | 28.0% |
| 2008 | 6.0% | 28.0% | 25.0% |
| CST Algebra II Test | |||
| 2010 | 38.0% | 39.0% | 31.0% |
| 2009 | 46.0% | 40.0% | 28.0% |
| 2008 | 44.0% | 37.0% | 27.0% |
| CST Biology Test | |||
| 2010 | 52.0% | 44.0% | 46.0% |
| 2009 | 59.0% | 45.0% | 42.0% |
| 2008 | 58.0% | 46.0% | 42.0% |
| CST Chemistry Test | |||
| 2010 | 59.0% | 44.0% | 38.0% |
| 2009 | 48.0% | 34.0% | 36.0% |
| 2008 | 36.0% | 23.0% | 32.0% |
| CST Earth Science Test | |||
| 2010 | 51.0% | 37.0% | 33.0% |
| 2009 | 40.0% | 27.0% | 28.0% |
| 2008 | 46.0% | 31.0% | 28.0% |
| CST Geometry Test | |||
| 2010 | 29.0% | 32.0% | 27.0% |
| 2009 | 22.0% | 25.0% | 26.0% |
| 2008 | 29.0% | 26.0% | 24.0% |
| CST Integrated Math 1 Test | |||
| 2010 | 6.0% | 7.0% | 13.0% |
| 2009 | 5.0% | 4.0% | 11.0% |
| 2008 | 3.0% | 3.0% | 11.0% |
| CST Physics Test | |||
| 2010 | 92.0% | 91.0% | 49.0% |
| 2009 | 87.0% | 77.0% | 46.0% |
| 2008 | 84.0% | 79.0% | 43.0% |
| CST Summative High School Math Test | |||
| 2010 | 82.0% | 73.0% | 54.0% |
| 2009 | 80.0% | 65.0% | 50.0% |
| 2008 | 73.0% | 63.0% | 47.0% |
| CST World History Test | |||
| 2010 | 58.0% | 45.0% | 41.0% |
| 2009 | 55.0% | 45.0% | 38.0% |
| 2008 | 46.0% | 34.0% | 33.0% |
Source: CA Department of Education 2009-2010
School Map and Similar Schools Nearby
Click to Activate Map of Nearby School Campuses
Private
Public
This School
Similar Schools Nearby
| Nogales High School 9-12 | 2,252 Students | 2.0 miles away | ![]() 3.5 out of 5 | |
| Diamond Bar High School 9-12 | 3,110 Students | 2.7 miles away | Not Yet Rated | |
| Glen A. Wilson High School 9-12 | 1,748 Students | 3.2 miles away | Not Yet Rated | |
| Walnut High School 9-12 | 2,920 Students | 3.3 miles away | ![]() 5 out of 5 | |
| William Workman High School 9-12 | 1,202 Students | 4.4 miles away | ![]() 4 out of 5 | |
| La Puente High School 9-12 | 1,666 Students | 5.0 miles away | ![]() 3 out of 5 | |
| Los Altos High School 9-12 | 2,056 Students | 5.5 miles away | ![]() 5 out of 5 | |
| West Covina High School 9-12 | 2,914 Students | 5.8 miles away | ![]() 4 out of 5 | |
| International Polytechnic High School 9-12 | 586 Students | 6.0 miles away | ![]() 4 out of 5 | |
| South Hills High School 9-12 | 2,067 Students | 6.7 miles away | ![]() 5 out of 5 | |
Compare This School To Nearby Schools ->
School Community Forum

Join a discussion about John A. Rowland High School and talk to others in the community including students, parents, teachers, and administrators.
Popular Discussion Topics
- Admissions and Registration Questions (e.g. Dress Code and Discipline Policy)
- School Calendar and Upcoming Events (e.g. Graduation)
- After School Programs, Extracurricular Activities, and Athletics (e.g. Football)
- News and Announcements (e.g. Yearbook and Class Supply List Details)
- Graduate and Alumni Events (e.g. Organizing Class Reunions)
Navigation
Can't Find What You Are Looking For?
Rankings
Nearby Cities
Sponsored Links
K-12 Articles
Simple Math ... a Simple Gift
Math affects every aspect of our lives-from balancing the checkbook to estimating the amount of...
Grammar...not Just Extended Family Anymore!
Can I talk to y'all abit about grammar? Right grammar and punctuations got to be some of the...
Special Needs Education: Your Child, Your Rights
Many children today have special needs that make it difficult for them to learn. It's imperative...


