Northam Elementary School
Rating
Not Available
Not Available

No Reviews Yet
Find Old Friends From Northam Elementary School
Use the form below to search for alumni from Northam Elementary School.
School Description
School Summary and Highlights
- Enrolls 650 elementary school students from grades KG-6
- Ranks 4437th out of 5,423 elementary schools in CA.
- 2010 Overall School AYP Met Status: No
School Operational Details
- Title I EligibleAll students of this school are eligible for participation in authorized programs.
School District Details
- Rowland Unified School District
- Per-Pupil Spending: $8,914
- Graduation Rate: 66.9%
- Dropout Rate: 2.2%
- Students Per Teacher: 22.5
- Enrolled Students: 15,971
Faculty Details and Student Enrollment
Students and Faculty
- Total Students Enrolled: 650
- Total Full Time "Equivalent" Teachers: 30.0
- Average Student-To-Teacher Ratio: 21.7
Students Gender Breakdown
- Males: 334 (51.4%)
- Females: 316 (48.6%)
Free Lunch Student Eligibility Breakdown
- Eligible for Reduced Lunch: 92 (14.2%)
- Eligible for Free Lunch: 523 (80.5%)
- Eligible for Either Reduced or Free Lunch: 615 (94.6%)
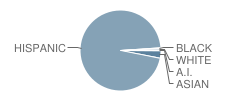
Student Enrollment Distribution by Race / Ethnicity
| Number | Percent | |
|---|---|---|
| American Indian | 1 | 0.2% |
| Black | 2 | 0.3% |
| Asian | 19 | 2.9% |
| Hispanic | 620 | 95.4% |
| White | 5 | 0.8% |
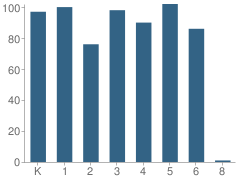
Number of Students Per Grade
| Number | Percent | |
|---|---|---|
| Kindergarten | 97 | 14.9% |
| 1st Grade | 100 | 15.4% |
| 2nd Grade | 76 | 11.7% |
| 3rd Grade | 98 | 15.1% |
| 4th Grade | 90 | 13.8% |
| 5th Grade | 102 | 15.7% |
| 6th Grade | 86 | 13.2% |
| 8th Grade | 1 | 0.2% |
Teacher Education Background (2009)
Percent With Master's Degree
School:
23.7%
District:
14.3%
Percent With Bachelor's Degree
School:
10.5%
District:
14.3%
Teacher Credentials & Experience (2009)
Percent of Teachers With Emergency Credentials: 16.7%
Percent of Teachers With Credentials: 100.0%
Number of Certificated Staff: 38.0
Average Number of Years of Teacher Experience: 13.0
Average Age
School:
40.9
District:
47.0
Source: CA Department of Education, Source: NCES 2009-2010
School Ratings and Reviews
Be The First To Review Northam Elementary School!
School Map and Similar Schools Nearby
Click to Activate Map of Nearby School Campuses
Private
Public
This School
Similar Schools Nearby
| Villacorta Elementary School KG-6 | 613 Students | 0.3 miles away | Not Yet Rated | |
| Yorbita Elementary School KG-6 | 650 Students | 0.5 miles away | Not Yet Rated | |
| Hurley Elementary School KG-6 | 644 Students | 0.8 miles away |  5 out of 5 | |
| La Seda Elementary School KG-6 | 504 Students | 0.9 miles away | Not Yet Rated | |
| Rorimer Elementary School KG-6 | 570 Students | 1.3 miles away | Not Yet Rated | |
| Wing Lane Elementary School KG-5 | 385 Students | 1.3 miles away |  4 out of 5 | |
| Grandview Elementary School KG-5 | 273 Students | 1.3 miles away | Not Yet Rated | |
| Stanley G. Oswalt Elementary School KG-8 | 932 Students | 1.4 miles away | Not Yet Rated | |
| Jellick Elementary School KG-6 | 395 Students | 1.7 miles away | Not Yet Rated | |
| Wedgeworth Elementary School KG-5 | 287 Students | 1.8 miles away | 5 out of 5 | |
Compare This School To Nearby Schools ->
School Community Forum

Join a discussion about Northam Elementary School and talk to others in the community including students, parents, teachers, and administrators.
Popular Discussion Topics
- Admissions and Registration Questions (e.g. Dress Code and Discipline Policy)
- School Calendar and Upcoming Events (e.g. Graduation)
- After School Programs, Extracurricular Activities, and Athletics (e.g. Football)
- News and Announcements (e.g. Yearbook and Class Supply List Details)
- Graduate and Alumni Events (e.g. Organizing Class Reunions)
Navigation
Can't Find What You Are Looking For?
Rankings
Nearby Cities
Sponsored Links
K-12 Articles

Se Hablan Otras Idiomas?
In the late 1990s, the Salem-Keizer school district in Oregon began requiring every student in its...
In the late 1990s, the Salem-Keizer school district in Oregon began requiring every student in its...

Helping Young Children with Printing and Cursive Writing
Is your child experiencing difficulty printing or writing? Is he unable to print or write legibly,...
Is your child experiencing difficulty printing or writing? Is he unable to print or write legibly,...

What to Do when Your Student is Held Back
Kids develop at different speeds, and everyone has different skills and abilities. School is easy...
Kids develop at different speeds, and everyone has different skills and abilities. School is easy...