Ybarra Elementary School
1300 South Brea Canyon Cutoff, Walnut, CA 91789 | (909) 598-3744
- Grades: KG-8
- Student Enrollment: 602
Rating
Not Available
Not Available

4 out of 5 | 1 Review
Find Old Friends From Ybarra Elementary School
Use the form below to search for alumni from Ybarra Elementary School.
School Description
School Summary and Highlights
- Enrolls 602 elementary school students from grades KG-8
- Ranks 440th out of 2,050 middle schools in CA.
- 2010 Overall School AYP Met Status: Yes
School District Details
- Rowland Unified School District
- Per-Pupil Spending: $8,914
- Graduation Rate: 66.9%
- Dropout Rate: 2.2%
- Students Per Teacher: 22.5
- Enrolled Students: 15,971
Faculty Details and Student Enrollment
Students and Faculty
- Total Students Enrolled: 602
- Total Full Time "Equivalent" Teachers: 28.0
- Average Student-To-Teacher Ratio: 21.5
Students Gender Breakdown
- Males: 320 (53.2%)
- Females: 282 (46.8%)
Free Lunch Student Eligibility Breakdown
- Eligible for Reduced Lunch: 77 (12.8%)
- Eligible for Free Lunch: 114 (18.9%)
- Eligible for Either Reduced or Free Lunch: 191 (31.7%)
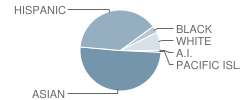
Student Enrollment Distribution by Race / Ethnicity
| Number | Percent | |
|---|---|---|
| American Indian | 1 | 0.2% |
| Black | 16 | 2.7% |
| Asian | 289 | 48.0% |
| Hispanic | 220 | 36.5% |
| White | 42 | 7.0% |
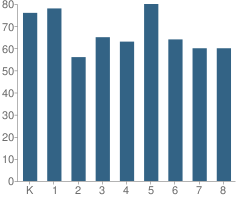
Number of Students Per Grade
| Number | Percent | |
|---|---|---|
| Kindergarten | 76 | 12.6% |
| 1st Grade | 78 | 13.0% |
| 2nd Grade | 56 | 9.3% |
| 3rd Grade | 65 | 10.8% |
| 4th Grade | 63 | 10.5% |
| 5th Grade | 80 | 13.3% |
| 6th Grade | 64 | 10.6% |
| 7th Grade | 60 | 10.0% |
| 8th Grade | 60 | 10.0% |
Teacher Education Background (2009)
Percent With Master's Degree
School:
27.6%
District:
14.3%
Percent With Bachelor's Degree
School:
10.3%
District:
14.3%
Teacher Credentials & Experience (2009)
Percent of Teachers With Emergency Credentials: 7.1%
Percent of Teachers With Credentials: 96.4%
Number of Certificated Staff: 29.0
Average Number of Years of Teacher Experience: 15.6
Average Age
School:
44.8
District:
47.0
Source: CA Department of Education, Source: NCES 2009-2010
School Ratings and Reviews
Overall Rating: 4

4 out of 5 | 1 Review
The Overall Rating is the school's average rating from parents, students, school faculty and staff. The highest rating is five apples and the lowest is one apple.
Share Your Review About This School
1 review for Ybarra Elementary School
- Reviewed by Student on April 09, 2008
- Rating:
 (4 / 5) Flag as inappropriate
 - Ybarra is very good!
School Map and Similar Schools Nearby
Click to Activate Map of Nearby School Campuses
Private
Public
This School
Similar Schools Nearby
| Shelyn Elementary School KG-6 | 436 Students | 0.7 miles away |  5 out of 5 | |
| Killian Elementary School KG-6 | 629 Students | 1.1 miles away | Not Yet Rated | |
| Hollingworth Elementary School KG-6 | 644 Students | 1.1 miles away | 5 out of 5 | |
| Walnut Elementary School KG-5 | 420 Students | 1.3 miles away | Not Yet Rated | |
| Cyrus J. Morris Elementary School KG-5 | 453 Students | 1.4 miles away | Not Yet Rated | |
| Rorimer Elementary School KG-6 | 570 Students | 1.6 miles away | Not Yet Rated | |
| Jellick Elementary School KG-6 | 395 Students | 1.6 miles away | Not Yet Rated | |
| Farjardo Elementary School KG-6 | 449 Students | 1.8 miles away | 5 out of 5 | |
| Vejar Elementary School KG-5 | 525 Students | 1.9 miles away | Not Yet Rated | |
| Blandford Elementary School KG-6 | 657 Students | 2.0 miles away |  3 out of 5 | |
Compare This School To Nearby Schools ->
School Community Forum

Join a discussion about Ybarra Elementary School and talk to others in the community including students, parents, teachers, and administrators.
Popular Discussion Topics
- Admissions and Registration Questions (e.g. Dress Code and Discipline Policy)
- School Calendar and Upcoming Events (e.g. Graduation)
- After School Programs, Extracurricular Activities, and Athletics (e.g. Football)
- News and Announcements (e.g. Yearbook and Class Supply List Details)
- Graduate and Alumni Events (e.g. Organizing Class Reunions)
Navigation
Can't Find What You Are Looking For?
Rankings
Nearby Cities
Sponsored Links
K-12 Articles

Asperger Syndrome: A Developmental Disorder on the Autism Spectrum
Asperger Syndrome, also known as Pervasive Developmental Disorder is on the high functioning end of...
Asperger Syndrome, also known as Pervasive Developmental Disorder is on the high functioning end of...

The Difference Between Boys and Girls
Boys and girls are different. Give a toddler girl a G.I. Joe and she'll probably try to mother it....
Boys and girls are different. Give a toddler girl a G.I. Joe and she'll probably try to mother it....

Hurt: A Book Report
My last book report was over 15 years ago, and I'm a bit rusty, but here goes (Don't forget: book...
My last book report was over 15 years ago, and I'm a bit rusty, but here goes (Don't forget: book...