David Lubin Elementary School
Rating
Not Available
Not Available

No Reviews Yet
Find Old Friends From David Lubin Elementary School
Use the form below to search for alumni from David Lubin Elementary School.
School Description
School Summary and Highlights
- Enrolls 517 elementary school students from grades KG-6
- Ranks 1767th out of 5,423 elementary schools in CA.
- 2010 Overall School AYP Met Status: Yes
Additional Contact Information
- Mailing Address: 3535 M St., Sacramento, CA 95816
School Operational Details
- Title I EligibleAll students of this school are eligible for participation in authorized programs.
School District Details
- Sacramento City Unified School District
- Per-Pupil Spending: $10,051
- Graduation Rate: 57.9%
- Dropout Rate: 3.7%
- Students Per Teacher: 21.2
- Enrolled Students: 47,532
Faculty Details and Student Enrollment
Students and Faculty
- Total Students Enrolled: 517
- Total Full Time "Equivalent" Teachers: 26.0
- Average Student-To-Teacher Ratio: 19.9
Students Gender Breakdown
- Males: 240 (46.4%)
- Females: 277 (53.6%)
Free Lunch Student Eligibility Breakdown
- Eligible for Reduced Lunch: 48 (9.3%)
- Eligible for Free Lunch: 186 (36.0%)
- Eligible for Either Reduced or Free Lunch: 234 (45.3%)
Student Enrollment Distribution by Race / Ethnicity
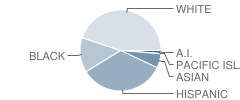
| Number | Percent | |
|---|---|---|
| American Indian | 6 | 1.2% |
| Black | 68 | 13.2% |
| Asian | 28 | 5.4% |
| Hispanic | 167 | 32.3% |
| White | 219 | 42.4% |
Number of Students Per Grade
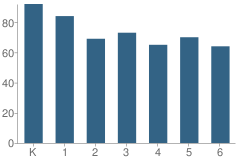
| Number | Percent | |
|---|---|---|
| Kindergarten | 92 | 17.8% |
| 1st Grade | 84 | 16.2% |
| 2nd Grade | 69 | 13.3% |
| 3rd Grade | 73 | 14.1% |
| 4th Grade | 65 | 12.6% |
| 5th Grade | 70 | 13.5% |
| 6th Grade | 64 | 12.4% |
Teacher Education Background (2009)
Percent With Master's Degree
School:
3.7%
District:
14.6%
Percent With Bachelor's Degree
School:
25.9%
District:
33.0%
Teacher Credentials & Experience (2009)
Percent of Teachers With Emergency Credentials: 4.2%
Percent of Teachers With Credentials: 95.8%
Number of Certificated Staff: 27.0
Average Number of Years of Teacher Experience: 14.8
Average Age
School:
46.6
District:
45.1
Source: CA Department of Education, Source: NCES 2009-2010
School Ratings and Reviews
Be The First To Review David Lubin Elementary School!
School Map and Similar Schools Nearby
Click to Activate Map of Nearby School Campuses
Private
Public
This School
Similar Schools Nearby
| Theodore Judah Elementary School KG-6 | 375 Students | 0.8 miles away | Not Yet Rated | |
| Washington Elementary School KG-6 | 242 Students | 1.4 miles away |  1 out of 5 | |
| Phoebe A. Hearst Elementary School 1-6 | 528 Students | 1.7 miles away |  5 out of 5 | |
| Caleb Greenwood School KG-8 | 566 Students | 1.7 miles away | Not Yet Rated | |
| Father Keith B. Kenny Elementary Charter School KG-6 | 312 Students | 1.9 miles away | Not Yet Rated | |
| Bret Harte Elementary School KG-6 | 493 Students | 1.9 miles away | Not Yet Rated | |
| William Land Elementary School KG-6 | 276 Students | 1.9 miles away | Not Yet Rated | |
| Tahoe Elementary School KG-6 | 358 Students | 2.0 miles away | 5 out of 5 | |
| Oak Ridge Elementary School KG-6 | 459 Students | 2.4 miles away | Not Yet Rated | |
| Woodlake Elementary School KG-6 | 385 Students | 2.4 miles away | Not Yet Rated | |
Compare This School To Nearby Schools ->
School Community Forum

Join a discussion about David Lubin Elementary School and talk to others in the community including students, parents, teachers, and administrators.
Popular Discussion Topics
- Admissions and Registration Questions (e.g. Dress Code and Discipline Policy)
- School Calendar and Upcoming Events (e.g. Graduation)
- After School Programs, Extracurricular Activities, and Athletics (e.g. Football)
- News and Announcements (e.g. Yearbook and Class Supply List Details)
- Graduate and Alumni Events (e.g. Organizing Class Reunions)
Navigation
Can't Find What You Are Looking For?
Rankings
Nearby Cities
Sponsored Links
K-12 Articles

Break the Cycle: Teen Dating Violence and Prevention Week
February 5 through 9 was "National Teen Dating Violence Awareness and Prevention Week"....
February 5 through 9 was "National Teen Dating Violence Awareness and Prevention Week"....

School Violence: Can It Be Stopped
It's a fact that violence in schools is prevalent in today's society. We hear of school shootings,...
It's a fact that violence in schools is prevalent in today's society. We hear of school shootings,...

Information on Cyberbullying
What is Cyberbullying? Cyberbullying is a new form of harassment, emotional abuse,...
What is Cyberbullying? Cyberbullying is a new form of harassment, emotional abuse,...