El Toro High School

5 out of 5 | 1 Review
Find Old Friends From El Toro High School
Use the form below to search for alumni from El Toro High School.
School Description
School Summary and Highlights
- Enrolls 2,925 high school students from grades 9-12
- Ranks 130th out of 1,197 high schools in CA.
- 2010 Overall School AYP Met Status: No
School District Details
- Saddleback Valley Unified School District
- Per-Pupil Spending: $8,023
- Graduation Rate: 86.2%
- Dropout Rate: 0.7%
- Students Per Teacher: 24.7
- Enrolled Students: 32,356
Faculty Details and Student Enrollment
Students and Faculty
- Total Students Enrolled: 2,925
- Total Full Time "Equivalent" Teachers: 110.0
- Average Student-To-Teacher Ratio: 26.6
Students Gender Breakdown
- Males: 1,524 (52.1%)
- Females: 1,401 (47.9%)
Free Lunch Student Eligibility Breakdown
- Eligible for Reduced Lunch: 117 (4.0%)
- Eligible for Free Lunch: 344 (11.8%)
- Eligible for Either Reduced or Free Lunch: 461 (15.8%)
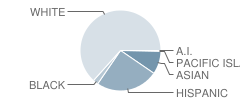
Student Enrollment Distribution by Race / Ethnicity

| Number | Percent | |
|---|---|---|
| American Indian | 7 | 0.2% |
| Black | 62 | 2.1% |
| Asian | 263 | 9.0% |
| Hispanic | 711 | 24.3% |
| White | 1,798 | 61.5% |
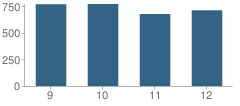
Number of Students Per Grade

| Number | Percent | |
|---|---|---|
| 9th Grade | 768 | 26.3% |
| 10th Grade | 770 | 26.3% |
| 11th Grade | 676 | 23.1% |
| 12th Grade | 711 | 24.3% |
Graduates Information (2010)
Graduation Rate
School:
96.2%
District:
94.4%
State:
78.6%
Teacher Education Background (2009)
Percent With Ph.D.
School:
1.7%
District:
8.2%
Percent With Master's Degree
School:
57.8%
District:
65.5%
Percent With Bachelor's Degree
School:
86.2%
District:
10.0%
Teacher Credentials & Experience (2009)
Percent of Teachers With Credentials: 100.0%
Number of Certificated Staff: 116.0
Average Number of Years of Teacher Experience: 17.9
Average Age
School:
44.8
District:
47.9
Source: CA Department of Education, Source: NCES 2009-2010
Sponsored Links
Test Scores and Performance Information
Overall School Rating
How is this determined?
The overall school rating shows that El Toro High School performed on average better than many other schools across the state on CST state exams in the following subjects:
- CST Algebra I
- CST Algebra II
- CST Biology
- CST Chemistry
- CST Earth Science
- CST English-Language Arts
- CST General Mathematics
- CST Geometry
- CST Integrated/Coordinated Science
- CST Physics
- CST Science
- CST Summative High School Math
- CST U.S. History
- CST World History
AYP Results (2010)
Overall AYP Met: No
ELA AYP Met: No
Math AYP Met: No
ACT Exam Results (2009)
Percent of Students Taking ACT Exam: 26.6%
Average Combined Score: 24.0
Percent Scoring At or Above 21: 80.4%
SAT Exam Results (2009)
Percent of Students Taking SAT Exam: 51.5%
Average Combined Score: 1,610.8
Critical Reading Average: 527.4
Math Average: 563.3
Writing Average: 520.0
Percent Scoring At or Above 1500: 66.0%
CST - Test Proficiency by Grade and Subject
Grade 9 - % of students at or above proficiency
| School | District | State | |
|---|---|---|---|
| CST Algebra I Test | |||
| 2010 | 33.0% | 35.0% | 22.0% |
| 2009 | 31.0% | 35.0% | 21.0% |
| 2008 | 41.0% | 37.0% | 18.0% |
| CST Algebra II Test | |||
| 2010 | 96.0% | 96.0% | 69.0% |
| 2009 | 88.0% | 91.0% | 65.0% |
| 2008 | 86.0% | 88.0% | 66.0% |
| CST Biology Test | |||
| 2010 | 86.0% | 91.0% | 55.0% |
| 2009 | 87.0% | 91.0% | 51.0% |
| 2008 | 85.0% | 90.0% | 52.0% |
| CST Earth Science Test | |||
| 2010 | 47.0% | 55.0% | 35.0% |
| 2009 | 41.0% | 49.0% | 29.0% |
| 2008 | 51.0% | 54.0% | 31.0% |
| CST English-Language Arts Test | |||
| 2010 | 72.0% | 76.0% | 54.0% |
| 2009 | 67.0% | 73.0% | 50.0% |
| 2008 | 72.0% | 73.0% | 49.0% |
| CST General Mathematics Test | |||
| 2010 | 21.0% | 35.0% | 17.0% |
| 2009 | 25.0% | 32.0% | 17.0% |
| 2008 | 32.0% | 34.0% | 18.0% |
| CST Geometry Test | |||
| 2010 | 80.0% | 77.0% | 46.0% |
| 2009 | 82.0% | 78.0% | 47.0% |
| 2008 | 74.0% | 71.0% | 43.0% |
| CST World History Test | |||
| 2010 | 63.0% | 62.0% | 45.0% |
Grade 10 - % of students at or above proficiency
| School | District | State | |
|---|---|---|---|
| CST Algebra I Test | |||
| 2010 | 22.0% | 17.0% | 12.0% |
| 2009 | 16.0% | 15.0% | 11.0% |
| 2008 | 17.0% | 11.0% | 9.0% |
| CST Algebra II Test | |||
| 2010 | 75.0% | 64.0% | 40.0% |
| 2009 | 60.0% | 56.0% | 37.0% |
| 2008 | 70.0% | 65.0% | 36.0% |
| CST Biology Test | |||
| 2010 | 34.0% | 50.0% | 38.0% |
| 2009 | 35.0% | 47.0% | 34.0% |
| 2008 | 38.0% | 52.0% | 35.0% |
| CST Chemistry Test | |||
| 2010 | 84.0% | 80.0% | 47.0% |
| 2009 | 83.0% | 75.0% | 44.0% |
| 2008 | 81.0% | 78.0% | 41.0% |
| CST Earth Science Test | |||
| 2010 | 17.0% | 33.0% | 29.0% |
| CST English-Language Arts Test | |||
| 2010 | 63.0% | 65.0% | 45.0% |
| 2009 | 62.0% | 65.0% | 44.0% |
| 2008 | 60.0% | 63.0% | 41.0% |
| CST Geometry Test | |||
| 2010 | 43.0% | 34.0% | 14.0% |
| 2009 | 33.0% | 29.0% | 14.0% |
| 2008 | 36.0% | 32.0% | 12.0% |
| CST Integrated/Coordinated Science Test | |||
| 2010 | 33.0% | 32.0% | 14.0% |
| 2009 | 7.0% | 7.0% | 9.0% |
| 2008 | 19.0% | 19.0% | 7.0% |
| CST Science Test | |||
| 2010 | 61.0% | 70.0% | 46.0% |
| 2009 | 60.0% | 68.0% | 44.0% |
| 2008 | 55.0% | 62.0% | 40.0% |
| CST Summative High School Math Test | |||
| 2010 | 91.0% | 93.0% | 75.0% |
| 2009 | 97.0% | 90.0% | 71.0% |
| 2008 | 93.0% | 84.0% | 68.0% |
| CST World History Test | |||
| 2010 | 63.0% | 64.0% | 42.0% |
| 2009 | 64.0% | 62.0% | 38.0% |
| 2008 | 58.0% | 58.0% | 33.0% |
Grade 11 - % of students at or above proficiency
| School | District | State | |
|---|---|---|---|
| CST Algebra I Test | |||
| 2010 | 14.0% | 4.0% | 8.0% |
| 2009 | 6.0% | 6.0% | 8.0% |
| 2008 | 9.0% | 4.0% | 5.0% |
| CST Algebra II Test | |||
| 2010 | 30.0% | 21.0% | 14.0% |
| 2009 | 29.0% | 23.0% | 12.0% |
| 2008 | 15.0% | 17.0% | 11.0% |
| CST Biology Test | |||
| 2010 | 48.0% | 62.0% | 46.0% |
| 2009 | 23.0% | 58.0% | 41.0% |
| 2008 | 45.0% | 59.0% | 39.0% |
| CST Chemistry Test | |||
| 2010 | 59.0% | 51.0% | 30.0% |
| 2009 | 50.0% | 50.0% | 27.0% |
| 2008 | 44.0% | 46.0% | 25.0% |
| CST English-Language Arts Test | |||
| 2010 | 66.0% | 61.0% | 42.0% |
| 2009 | 59.0% | 59.0% | 40.0% |
| 2008 | 63.0% | 60.0% | 37.0% |
| CST Geometry Test | |||
| 2010 | 22.0% | 15.0% | 6.0% |
| 2009 | 18.0% | 15.0% | 7.0% |
| 2008 | 13.0% | 12.0% | 6.0% |
| CST Integrated/Coordinated Science Test | |||
| 2010 | 14.0% | 11.0% | 8.0% |
| 2009 | 6.0% | 17.0% | 11.0% |
| 2008 | 5.0% | 15.0% | 10.0% |
| CST Physics Test | |||
| 2010 | 82.0% | 82.0% | 53.0% |
| 2009 | 83.0% | 83.0% | 50.0% |
| 2008 | 83.0% | 84.0% | 47.0% |
| CST Summative High School Math Test | |||
| 2010 | 73.0% | 68.0% | 50.0% |
| 2009 | 78.0% | 70.0% | 47.0% |
| 2008 | 73.0% | 65.0% | 43.0% |
| CST U.S. History Test | |||
| 2010 | 67.0% | 66.0% | 45.0% |
| 2009 | 62.0% | 65.0% | 44.0% |
| 2008 | 67.0% | 60.0% | 38.0% |
| CST World History Test | |||
| 2010 | 18.0% | 27.0% | 15.0% |
| 2009 | - | - | - |
| 2008 | 6.0% | 7.0% | 9.0% |
| CST Earth Science Test | |||
| 2008 | 45.0% | 29.0% | 28.0% |
End of Course - % of students at or above proficiency
| School | District | State | |
|---|---|---|---|
| CST Algebra I Test | |||
| 2010 | 27.0% | 36.0% | 31.0% |
| 2009 | 22.0% | 46.0% | 28.0% |
| 2008 | 29.0% | 46.0% | 25.0% |
| CST Algebra II Test | |||
| 2010 | 57.0% | 48.0% | 31.0% |
| 2009 | 46.0% | 43.0% | 28.0% |
| 2008 | 42.0% | 43.0% | 27.0% |
| CST Biology Test | |||
| 2010 | 56.0% | 66.0% | 46.0% |
| 2009 | 55.0% | 64.0% | 42.0% |
| 2008 | 55.0% | 66.0% | 42.0% |
| CST Chemistry Test | |||
| 2010 | 75.0% | 63.0% | 38.0% |
| 2009 | 70.0% | 61.0% | 36.0% |
| 2008 | 65.0% | 58.0% | 32.0% |
| CST Earth Science Test | |||
| 2010 | 46.0% | 55.0% | 33.0% |
| 2009 | 39.0% | 48.0% | 28.0% |
| 2008 | 51.0% | 53.0% | 28.0% |
| CST General Mathematics Test | |||
| 2010 | 21.0% | 35.0% | 27.0% |
| 2009 | 25.0% | 49.0% | 26.0% |
| 2008 | 32.0% | 47.0% | 27.0% |
| CST Geometry Test | |||
| 2010 | 57.0% | 51.0% | 27.0% |
| 2009 | 52.0% | 49.0% | 26.0% |
| 2008 | 48.0% | 47.0% | 24.0% |
| CST Integrated/Coordinated Science Test | |||
| 2010 | 16.0% | 22.0% | 16.0% |
| 2009 | 6.0% | 5.0% | 13.0% |
| 2008 | 6.0% | 5.0% | 11.0% |
| CST Physics Test | |||
| 2010 | 82.0% | 84.0% | 49.0% |
| 2009 | 83.0% | 85.0% | 46.0% |
| 2008 | 83.0% | 85.0% | 43.0% |
| CST Summative High School Math Test | |||
| 2010 | 74.0% | 71.0% | 54.0% |
| 2009 | 81.0% | 74.0% | 50.0% |
| 2008 | 75.0% | 69.0% | 47.0% |
| CST World History Test | |||
| 2010 | 63.0% | 64.0% | 41.0% |
| 2009 | 63.0% | 61.0% | 38.0% |
| 2008 | 56.0% | 58.0% | 33.0% |
Source: CA Department of Education 2009-2010
School Map and Similar Schools Nearby
Click to Activate Map of Nearby School Campuses
Private
Public
This School
Similar Schools Nearby
| Trabuco Hills High School 9-12 | 3,262 Students | 2.4 miles away | Not Yet Rated | |
| Mission Viejo High School 9-12 | 2,782 Students | 2.9 miles away | ![]() 4 out of 5 | |
| Laguna Hills High School 9-12 | 1,810 Students | 3.1 miles away | ![]() 4 out of 5 | |
| Tesoro High School 9-12 | 2,622 Students | 5.6 miles away | Not Yet Rated | |
| Aliso Niguel High School 9-12 | 3,060 Students | 5.6 miles away | ![]() 5 out of 5 | |
| Capistrano Valley High School 9-12 | 2,842 Students | 6.6 miles away | Not Yet Rated | |
| Irvine High School 9-12 | 1,894 Students | 7.1 miles away | ![]() 5 out of 5 | |
| Northwood High School 9-12 | 2,025 Students | 7.4 miles away | Not Yet Rated | |
| Woodbridge High School 9-12 | 2,119 Students | 7.5 miles away | Not Yet Rated | |
| Arnold O. Beckman High School 9-12 | 2,208 Students | 7.8 miles away | Not Yet Rated | |
Compare This School To Nearby Schools ->
School Community Forum

Join a discussion about El Toro High School and talk to others in the community including students, parents, teachers, and administrators.
Popular Discussion Topics
- Admissions and Registration Questions (e.g. Dress Code and Discipline Policy)
- School Calendar and Upcoming Events (e.g. Graduation)
- After School Programs, Extracurricular Activities, and Athletics (e.g. Football)
- News and Announcements (e.g. Yearbook and Class Supply List Details)
- Graduate and Alumni Events (e.g. Organizing Class Reunions)
Navigation
Can't Find What You Are Looking For?
Rankings
Nearby Cities
Sponsored Links
K-12 Articles
Siblings and Individual Identity in High School
When the first day of high school looms in the near future, teens are both excited and anxious....
When Bad Report Cards Happen to Good Kids
It's mid-term season once again, and semester (or quarter or trimester) grades will be coming out...
School's out for Recess
Recess used to be the best part of school; that and lunch. But today, a shocking two-thirds of...


(5 / 5) 
