Cajon High School
Rating
Not Available
Not Available

4.5 out of 5 | 10 Reviews
Find Old Friends From Cajon High School
Use the form below to search for alumni from Cajon High School.
School Description
School Summary and Highlights
- Enrolls 2,913 high school students from grades 9-12
- Ranks 897th out of 1,197 high schools in CA.
- 2010 Overall School AYP Met Status: No
Additional Contact Information
- Mailing Address: 1200 Hill Dr., San Bernardino, CA 92407
School Operational Details
- Title I EligibleAll students of this school are eligible for participation in authorized programs.
School District Details
- San Bernardino City Unified School District
- Per-Pupil Spending: $9,765
- Graduation Rate: 49.0%
- Dropout Rate: 6.1%
- Students Per Teacher: 20.7
- Enrolled Students: 53,690
Faculty Details and Student Enrollment
Students and Faculty
- Total Students Enrolled: 2,913
- Total Full Time "Equivalent" Teachers: 117.0
- Average Student-To-Teacher Ratio: 24.9
Students Gender Breakdown
- Males: 1,487 (51.0%)
- Females: 1,426 (49.0%)
Free Lunch Student Eligibility Breakdown
- Eligible for Reduced Lunch: 519 (17.8%)
- Eligible for Free Lunch: 1,339 (46.0%)
- Eligible for Either Reduced or Free Lunch: 1,858 (63.8%)
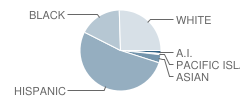
Student Enrollment Distribution by Race / Ethnicity
| Number | Percent | |
|---|---|---|
| American Indian | 40 | 1.4% |
| Black | 486 | 16.7% |
| Asian | 97 | 3.3% |
| Hispanic | 1,486 | 51.0% |
| White | 724 | 24.9% |
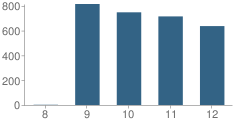
Number of Students Per Grade
| Number | Percent | |
|---|---|---|
| 8th Grade | 2 | 0.07% |
| 9th Grade | 814 | 27.9% |
| 10th Grade | 747 | 25.6% |
| 11th Grade | 714 | 24.5% |
| 12th Grade | 636 | 21.8% |
Graduates Information (2010)
Graduation Rate
School:
81.3%
District:
64.9%
State:
78.6%
Teacher Education Background (2009)
Percent With Master's Degree
School:
26.8%
District:
38.1%
Percent With Bachelor's Degree
School:
23.6%
District:
16.7%
Percent With Ph.D.
School:
1.6%
District:
2.8%
Teacher Credentials & Experience (2009)
Average Age
School:
46.0
District:
46.2
Average Number of Years of Teacher Experience: 14.4
Number of Certificated Staff: 127.0
Percent of Teachers With Credentials: 94.0%
Percent of Teachers With Emergency Credentials: 2.6%
Source: CA Department of Education, Source: NCES 2009-2010
School Ratings and Reviews
Overall Rating: 4.5

4.5 out of 5 | 10 Reviews
The Overall Rating is the school's average rating from parents, students, school faculty and staff. The highest rating is five apples and the lowest is one apple.
Share Your Review About This School
10 reviews for Cajon High School
- Reviewed by Student on February 04, 2011
- Rating:
 (5 / 5) Flag as inappropriate
 - This school is far the best school in the San Bernardino District...and i'm not just saying it..i'm saying it because of experience...I went there for my Freshman, Sophomore, and Junior year, but unfortunately i had to move to another city and left Cajon by the 2nd Semester, but all i can say that the teachers there are just SO amazing...they actually care about you..and if a parent calls them, they answer and try to help the parents as much as possible( happened several times to me when my mom called them). All in all, i can just say that this school is so amazing! i wouldn't of picked any other school besides this one.. If you are planning to go here..well, i recommend you 10001% to go here...it will be so great :)
- Reviewed by Student on September 17, 2009
- Rating: (5 / 5) Flag as inappropriate
- that school is just so bomb..... its the best school in sanbernardino
- Reviewed by Student on June 24, 2009
- Rating: (5 / 5) Flag as inappropriate
- What can i say...cajon is the best school EVER!!! Thats where i met so many people and everyones great... i didnt finish the year there because i had to move but it doesnt take along time to figure out that cajon is the bomest school out there!!!!
- Reviewed by Parent/Guardian on March 19, 2009
- Rating: (5 / 5) Flag as inappropriate
- CAJON IS THA BEZT
- Reviewed by Parent/Guardian on March 19, 2009
- Rating: (5 / 5) Flag as inappropriate
- I LOVE CAJON
- Reviewed by Student on December 12, 2008
- Rating: (5 / 5) Flag as inappropriate
- i love your school
- Reviewed by Former Student on February 28, 2008
- Rating: (5 / 5) Flag as inappropriate
- I graduated from Cajon last year, and they helped me graduate in every way. I was not the perfect student in any stretch of the imagination. I need constant help and teachers, counselors, VPs all helped. An admin is not going to help a student if the student doesn't care. If your student is going to school everyday there is no reason he/she should get behind! I worked hard and the diploma was worth it! Cajon was a great school! Thanks to all those who helped me succeed I now work full time right out of high school 40 hours a week making 10$ an hour! I did just fine!! Thanks to the staff of Cajon High School!
- Reviewed by Parent/Guardian on October 23, 2007
- Rating: (5 / 5) Flag as inappropriate
- Cajon is the best high school in San Bernardino. Most of the teachers are dedicated and helpful. The campus is safe and clean. There are many clubs and athletic teams available for student participation.
- Reviewed by Parent/Guardian on October 13, 2007
- Rating:
 (4 / 5) Flag as inappropriate
 - good
- Reviewed by Parent/Guardian on April 02, 2007
- Rating:
 (1 / 5) Flag as inappropriate
 - My student has been behind in credits for a year now. I have asked the staff of the school. I asked them to help me keep track of my students weekly assignments so I can make sure he is doing his work and the VP told me they cant help me and what I was asking for is too much work. My child goes to school everyday and still his grades are bad this is because he dose not complete assignments, assignments I have asked on several occasions to me made aware of and have received no help. I have set appointments with the teachers and had them not show. I thought the School was there to help students succeed not help them fail, especially in High School were the choices our children make help or hinder there future. The powers that be need to seriously take a look at the staff of Cajon High and make some drastic changes.
Read All 10 Reviews ->
School Map and Similar Schools Nearby
Click to Activate Map of Nearby School Campuses
Private
Public
This School
Similar Schools Nearby
| San Bernardino High School 9-12 | 2,456 Students | 3.2 miles away |  4 out of 5 | |
| Arroyo Valley High School 9-12 | 3,007 Students | 4.1 miles away |  5 out of 5 | |
| Pacific High School 9-12 | 2,330 Students | 4.1 miles away | 4 out of 5 | |
| San Gorgonio High School 9-12 | 3,177 Students | 5.3 miles away |  2.5 out of 5 | |
| Rialto High School 9-12 | 2,971 Students | 5.3 miles away |  4.5 out of 5 | |
| Eisenhower High School 9-12 | 2,395 Students | 5.3 miles away | Not Yet Rated | |
| Wilmer Amina Carter High School 9-12 | 2,563 Students | 5.6 miles away | 2.5 out of 5 | |
| Richardson Preparatory High School 6-8 | 612 Students | 5.7 miles away | 5 out of 5 | |
| Rim of the World High School 9-12 | 1,402 Students | 6.9 miles away |  3.5 out of 5 | |
| Colton High School 9-12 | 3,308 Students | 7.5 miles away | 4 out of 5 | |
Compare This School To Nearby Schools ->
School Community Forum

Join a discussion about Cajon High School and talk to others in the community including students, parents, teachers, and administrators.
Popular Discussion Topics
- Admissions and Registration Questions (e.g. Dress Code and Discipline Policy)
- School Calendar and Upcoming Events (e.g. Graduation)
- After School Programs, Extracurricular Activities, and Athletics (e.g. Football)
- News and Announcements (e.g. Yearbook and Class Supply List Details)
- Graduate and Alumni Events (e.g. Organizing Class Reunions)
Navigation
Can't Find What You Are Looking For?
Rankings
Nearby Cities
Sponsored Links
K-12 Articles

Choosing a Summer Camp for Your Child
Are you planning to send your child to summer camp this year? If so, have you taken his needs into...
Are you planning to send your child to summer camp this year? If so, have you taken his needs into...

Does Your Child's Teacher Make a Difference
School improvement is always in the news. Teachers demand smaller class sizes. The government calls...
School improvement is always in the news. Teachers demand smaller class sizes. The government calls...

The Impact on Adopted Children at School
Children who are adopted can be affected both academically and socially at school. Many times...
Children who are adopted can be affected both academically and socially at school. Many times...