Cole Elementary School
Rating
Not Available
Not Available

5 out of 5 | 1 Review
Find Old Friends From Cole Elementary School
Use the form below to search for alumni from Cole Elementary School.
School Description
School Summary and Highlights
- Enrolls 432 elementary school students from grades KG-6
- Ranks 4831st out of 5,423 elementary schools in CA.
- 2010 Overall School AYP Met Status: No
Additional Contact Information
- Mailing Address: 1331 Cole Ave., Highland, CA 92346
School Operational Details
- Title I EligibleAll students of this school are eligible for participation in authorized programs.
School District Details
- San Bernardino City Unified School District
- Per-Pupil Spending: $9,765
- Graduation Rate: 49.0%
- Dropout Rate: 6.1%
- Students Per Teacher: 20.7
- Enrolled Students: 53,690
Faculty Details and Student Enrollment
Students and Faculty
- Total Students Enrolled: 432
- Total Full Time "Equivalent" Teachers: 20.0
- Average Student-To-Teacher Ratio: 21.6
Students Gender Breakdown
- Males: 224 (51.9%)
- Females: 208 (48.1%)
Free Lunch Student Eligibility Breakdown
- Eligible for Reduced Lunch: 62 (14.4%)
- Eligible for Free Lunch: 329 (76.2%)
- Eligible for Either Reduced or Free Lunch: 391 (90.5%)
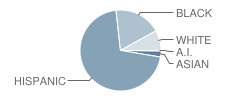
Student Enrollment Distribution by Race / Ethnicity
| Number | Percent | |
|---|---|---|
| American Indian | 1 | 0.2% |
| Black | 79 | 18.3% |
| Asian | 10 | 2.3% |
| Hispanic | 298 | 69.0% |
| White | 34 | 7.9% |
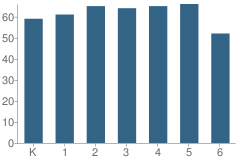
Number of Students Per Grade
| Number | Percent | |
|---|---|---|
| Kindergarten | 59 | 13.7% |
| 1st Grade | 61 | 14.1% |
| 2nd Grade | 65 | 15.0% |
| 3rd Grade | 64 | 14.8% |
| 4th Grade | 65 | 15.0% |
| 5th Grade | 66 | 15.3% |
| 6th Grade | 52 | 12.0% |
Teacher Education Background (2009)
Percent With Master's Degree
School:
17.4%
District:
38.1%
Percent With Bachelor's Degree
School:
30.4%
District:
16.7%
Teacher Credentials & Experience (2009)
Percent of Teachers With Credentials: 100.0%
Number of Certificated Staff: 23.0
Average Number of Years of Teacher Experience: 9.7
Average Age
School:
39.6
District:
46.2
Source: CA Department of Education, Source: NCES 2009-2010
School Ratings and Reviews
Overall Rating: 5

5 out of 5 | 1 Review
The Overall Rating is the school's average rating from parents, students, school faculty and staff. The highest rating is five apples and the lowest is one apple.
Share Your Review About This School
1 review for Cole Elementary School
- Reviewed by Former Student on October 12, 2010
- Rating:
 (5 / 5) Flag as inappropriate
 - I went to Cole Elementary School the year(half year)that it was opened.We were transfered down from Highland Pacific Elementary School.I was a student of Mrs.Page,and packed our desks up,at H-P-Eande walked to our new school.We were assigned,that year,to write a letter to our congressman,requesting a United States flag that had flown over the Capitol Building in Washington D.C.My letter was picked,and sent our congressman.I was told the letter was placed in a time capsule,encased in one of the walls,to be opened in fifty years.Has that time capsule been opened,yet,as I can't remember the year of the school opening? Thank you for your time .Sincerely,Lee J. Hatcher
School Map and Similar Schools Nearby
Click to Activate Map of Nearby School Campuses
Private
Public
This School
Similar Schools Nearby
| Highland Pacific Elementary School KG-6 | 383 Students | 0.3 miles away |  5 out of 5 | |
| Cypress Elementary School KG-6 | 553 Students | 0.8 miles away | 5 out of 5 | |
| Oehl Elementary School KG-6 | 533 Students | 1.2 miles away | Not Yet Rated | |
| Lankershim Elementary School KG-6 | 813 Students | 1.4 miles away | Not Yet Rated | |
| Emmerton Elementary School KG-6 | 517 Students | 1.4 miles away | Not Yet Rated | |
| Colonel Joseph C. Rodriguez Preparatory Academy 4-8 | 775 Students | 1.7 miles away | Not Yet Rated | - |
| Barton Elementary School KG-6 | 520 Students | 1.8 miles away |  1 out of 5 | |
| Warm Springs Elementary School KG-6 | 690 Students | 1.8 miles away | Not Yet Rated | |
| Highland Grove Elementary School KG-5 | 545 Students | 1.9 miles away | 5 out of 5 | |
| Belvedere Elementary School KG-6 | 719 Students | 2.1 miles away | 5 out of 5 | |
Compare This School To Nearby Schools ->
School Community Forum

Join a discussion about Cole Elementary School and talk to others in the community including students, parents, teachers, and administrators.
Popular Discussion Topics
- Admissions and Registration Questions (e.g. Dress Code and Discipline Policy)
- School Calendar and Upcoming Events (e.g. Graduation)
- After School Programs, Extracurricular Activities, and Athletics (e.g. Football)
- News and Announcements (e.g. Yearbook and Class Supply List Details)
- Graduate and Alumni Events (e.g. Organizing Class Reunions)
Navigation
Can't Find What You Are Looking For?
Rankings
Nearby Cities
Sponsored Links
K-12 Articles

School's out for Recess
Recess used to be the best part of school; that and lunch. But today, a shocking two-thirds of...
Recess used to be the best part of school; that and lunch. But today, a shocking two-thirds of...

A Cheat Sheet on Cheating
Senior projects are coming due and finals are coming up. Spring has sprung, and with spring comes...
Senior projects are coming due and finals are coming up. Spring has sprung, and with spring comes...

Everyone Loves Going to the Doctor and Dentist
Going to the doctor or dentist can be traumatic for children of all ages. Many adults do not...
Going to the doctor or dentist can be traumatic for children of all ages. Many adults do not...