Urbita Elementary School
Rating
Not Available
Not Available

No Reviews Yet
Find Old Friends From Urbita Elementary School
Use the form below to search for alumni from Urbita Elementary School.
School Description
School Summary and Highlights
- Enrolls 415 elementary school students from grades KG-6
- Ranks 3953rd out of 5,423 elementary schools in CA.
- 2010 Overall School AYP Met Status: No
Additional Contact Information
- Mailing Address: 771 South J St., San Bernardino, CA 92410
School Operational Details
- Title I EligibleAll students of this school are eligible for participation in authorized programs.
School District Details
- San Bernardino City Unified School District
- Per-Pupil Spending: $9,765
- Graduation Rate: 49.0%
- Dropout Rate: 6.1%
- Students Per Teacher: 20.7
- Enrolled Students: 53,690
Faculty Details and Student Enrollment
Students and Faculty
- Total Students Enrolled: 415
- Total Full Time "Equivalent" Teachers: 21.0
- Average Student-To-Teacher Ratio: 19.8
Students Gender Breakdown
- Males: 204 (49.2%)
- Females: 211 (50.8%)
Free Lunch Student Eligibility Breakdown
- Eligible for Reduced Lunch: 64 (15.4%)
- Eligible for Free Lunch: 303 (73.0%)
- Eligible for Either Reduced or Free Lunch: 367 (88.4%)
Student Enrollment Distribution by Race / Ethnicity
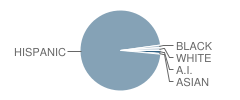
| Number | Percent | |
|---|---|---|
| American Indian | 5 | 1.2% |
| Black | 4 | 1.0% |
| Asian | 1 | 0.2% |
| Hispanic | 400 | 96.4% |
| White | 5 | 1.2% |
Number of Students Per Grade
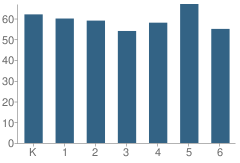
| Number | Percent | |
|---|---|---|
| Kindergarten | 62 | 14.9% |
| 1st Grade | 60 | 14.5% |
| 2nd Grade | 59 | 14.2% |
| 3rd Grade | 54 | 13.0% |
| 4th Grade | 58 | 14.0% |
| 5th Grade | 67 | 16.1% |
| 6th Grade | 55 | 13.3% |
Teacher Education Background (2009)
Percent With Master's Degree
School:
34.8%
District:
38.1%
Percent With Bachelor's Degree
School:
47.8%
District:
16.7%
Teacher Credentials & Experience (2009)
Percent of Teachers With Credentials: 100.0%
Number of Certificated Staff: 23.0
Average Number of Years of Teacher Experience: 10.6
Average Age
School:
41.7
District:
46.2
Source: CA Department of Education, Source: NCES 2009-2010
School Ratings and Reviews
Be The First To Review Urbita Elementary School!
School Map and Similar Schools Nearby
Click to Activate Map of Nearby School Campuses
Private
Public
This School
Similar Schools Nearby
| Alice Birney Elementary School KG-6 | 769 Students | 0.6 miles away | Not Yet Rated | |
| Lytle Creek Elementary School KG-6 | 763 Students | 0.8 miles away | Not Yet Rated | |
| Abraham Lincoln Elementary School KG-6 | 707 Students | 0.9 miles away | Not Yet Rated | |
| Burbank Elementary School KG-6 | 395 Students | 1.1 miles away |  5 out of 5 | |
| William Mckinley Elementary School KG-6 | 640 Students | 1.5 miles away | 5 out of 5 | |
| Ulysses Grant Elementary School KG-6 | 802 Students | 1.5 miles away | Not Yet Rated | |
| Juanita Blakely Jones Elementary School KG-6 | 479 Students | 1.9 miles away | Not Yet Rated | |
| Ramona-Alessandro Elementary School KG-5 | 673 Students | 2.0 miles away | Not Yet Rated | |
| Paul Rogers Elementary School KG-6 | 758 Students | 2.0 miles away | Not Yet Rated | |
| Mt. Vernon Elementary School KG-5 | 661 Students | 2.2 miles away |  4 out of 5 | |
Compare This School To Nearby Schools ->
School Community Forum

Join a discussion about Urbita Elementary School and talk to others in the community including students, parents, teachers, and administrators.
Popular Discussion Topics
- Admissions and Registration Questions (e.g. Dress Code and Discipline Policy)
- School Calendar and Upcoming Events (e.g. Graduation)
- After School Programs, Extracurricular Activities, and Athletics (e.g. Football)
- News and Announcements (e.g. Yearbook and Class Supply List Details)
- Graduate and Alumni Events (e.g. Organizing Class Reunions)
Navigation
Can't Find What You Are Looking For?
Rankings
Nearby Cities
Sponsored Links
K-12 Articles

The First Day of School
The first day of kindergarten is a rite of passage for any student. Every mother cries and...
The first day of kindergarten is a rite of passage for any student. Every mother cries and...

Teaching Children Respect
Statistics prove that there are many different family types in today's society. Grandparents or a...
Statistics prove that there are many different family types in today's society. Grandparents or a...

Kids and Competition
In the backyard, the classroom, the community and while participating in sports and other...
In the backyard, the classroom, the community and while participating in sports and other...