Central Middle School
Rating
Not Available
Not Available

No Reviews Yet
Find Old Friends From Central Middle School
Use the form below to search for alumni from Central Middle School.
School Description
School Summary and Highlights
- Enrolls 608 elementary and middle school students from grades 5-8
- Ranks 114th out of 2,050 middle schools in CA.
- 2010 Overall School AYP Met Status: Yes
- National Blue Ribbon Schools Award 2006

Additional Contact Information
- Mailing Address: 828 Chestnut St., San Carlos, CA 94070
School District Details
- San Carlos Elementary School District
- Per-Pupil Spending: $8,446
- Students Per Teacher: 19.7
- Enrolled Students: 3,078
Faculty Details and Student Enrollment
Students and Faculty
- Total Students Enrolled: 608
- Total Full Time "Equivalent" Teachers: 30.6
- Average Student-To-Teacher Ratio: 19.9
Students Gender Breakdown
- Males: 330 (54.3%)
- Females: 278 (45.7%)
Free Lunch Student Eligibility Breakdown
- Eligible for Reduced Lunch: 11 (1.8%)
- Eligible for Free Lunch: 20 (3.3%)
- Eligible for Either Reduced or Free Lunch: 31 (5.1%)
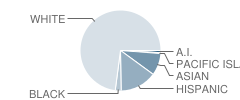
Student Enrollment Distribution by Race / Ethnicity
| Number | Percent | |
|---|---|---|
| American Indian | 6 | 1.0% |
| Black | 15 | 2.5% |
| Asian | 54 | 8.9% |
| Hispanic | 89 | 14.6% |
| White | 438 | 72.0% |
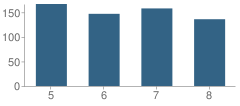
Number of Students Per Grade
| Number | Percent | |
|---|---|---|
| 5th Grade | 167 | 27.5% |
| 6th Grade | 147 | 24.2% |
| 7th Grade | 158 | 26.0% |
| 8th Grade | 136 | 22.4% |
Teacher Education Background (2009)
Percent With Ph.D.
School:
3.1%
District:
9.1%
Percent With Master's Degree
School:
12.5%
District:
45.5%
Percent With Bachelor's Degree
School:
9.4%
District:
9.1%
Teacher Credentials & Experience (2009)
Percent of Teachers With Emergency Credentials: 3.4%
Percent of Teachers With Credentials: 93.1%
Number of Certificated Staff: 32.0
Average Number of Years of Teacher Experience: 11.9
Average Age
School:
41.8
District:
44.7
Source: CA Department of Education, Source: NCES 2009-2010
School Ratings and Reviews
Be The First To Review Central Middle School!
School Map and Similar Schools Nearby
Click to Activate Map of Nearby School Campuses
Private
Public
This School
Similar Schools Nearby
| Clifford Elementary School KG-8 | 794 Students | 1.4 miles away |  5 out of 5 | |
| Nesbit Elementary School KG-6 | 513 Students | 1.8 miles away | Not Yet Rated | |
| North Star Academy 3-8 | 536 Students | 1.9 miles away | Not Yet Rated | |
| Central Elementary School KG-6 | 493 Students | 2.0 miles away | Not Yet Rated | |
| Cipriani Elementary School KG-6 | 394 Students | 2.7 miles away | Not Yet Rated | |
| Ralston Intermediate School 6-9 | 883 Students | 2.9 miles away | Not Yet Rated | |
| Hoover Elementary School KG-8 | 856 Students | 2.9 miles away | Not Yet Rated | |
| Sandpiper Elementary School 1-6 | 645 Students | 2.9 miles away | Not Yet Rated | |
| Roy Cloud Elementary School KG-8 | 767 Students | 3.0 miles away | Not Yet Rated | |
| Abbott Middle School 6-8 | 749 Students | 3.3 miles away | Not Yet Rated | |
Compare This School To Nearby Schools ->
School Community Forum

Join a discussion about Central Middle School and talk to others in the community including students, parents, teachers, and administrators.
Popular Discussion Topics
- Admissions and Registration Questions (e.g. Dress Code and Discipline Policy)
- School Calendar and Upcoming Events (e.g. Graduation)
- After School Programs, Extracurricular Activities, and Athletics (e.g. Football)
- News and Announcements (e.g. Yearbook and Class Supply List Details)
- Graduate and Alumni Events (e.g. Organizing Class Reunions)
Navigation
Can't Find What You Are Looking For?
Rankings
Nearby Cities
Sponsored Links
K-12 Articles

All About Backpacks
Your child riffles through his backpack to find homework assignments, his MP3 player, lunch money...
Your child riffles through his backpack to find homework assignments, his MP3 player, lunch money...

Homework Tips: Taking the Work out of Homework
Kids hate homework. It seems that almost every night of the week they are overloaded with...
Kids hate homework. It seems that almost every night of the week they are overloaded with...

Teacher Tenure: A Double-Edged Sword
Teacher Tenure (the policy making it almost impossible to fire teachers) has noble roots. It was...
Teacher Tenure (the policy making it almost impossible to fire teachers) has noble roots. It was...