John Muir School

No Reviews Yet
Find Old Friends From John Muir School
Use the form below to search for alumni from John Muir School.
School Description
School Summary and Highlights
- Enrolls 380 elementary, middle, and high school students from grades KG-12
- Ranks 813th out of 1,197 high schools in CA.
- 2010 Overall School AYP Met Status: No
Additional Contact Information
- Mailing Address: 4431 Mt. Herbert Ave., San Diego, CA 92117
School Operational Details
- Title I EligibleAll students of this school are eligible for participation in authorized programs.
School District Details
- San Diego Unified School District
- Per-Pupil Spending: $10,305
- Graduation Rate: 63.0%
- Dropout Rate: 2.4%
- Students Per Teacher: 20.1
- Enrolled Students: 131,163
Faculty Details and Student Enrollment
Students and Faculty
- Total Students Enrolled: 380
- Total Full Time "Equivalent" Teachers: 22.3
- Average Student-To-Teacher Ratio: 17.1
Students Gender Breakdown
- Males: 183 (48.2%)
- Females: 197 (51.8%)
Free Lunch Student Eligibility Breakdown
- Eligible for Reduced Lunch: 151 (39.7%)
- Eligible for Free Lunch: 92 (24.2%)
- Eligible for Either Reduced or Free Lunch: 243 (63.9%)
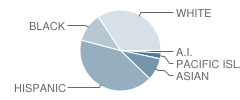
Student Enrollment Distribution by Race / Ethnicity

| Number | Percent | |
|---|---|---|
| American Indian | 5 | 1.3% |
| Black | 44 | 11.6% |
| Asian | 34 | 8.9% |
| Hispanic | 154 | 40.5% |
| White | 126 | 33.2% |
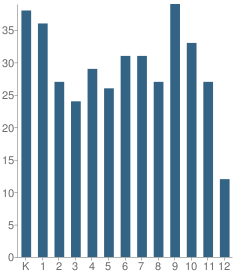
Number of Students Per Grade

| Number | Percent | |
|---|---|---|
| Kindergarten | 38 | 10.0% |
| 1st Grade | 36 | 9.5% |
| 2nd Grade | 27 | 7.1% |
| 3rd Grade | 24 | 6.3% |
| 4th Grade | 29 | 7.6% |
| 5th Grade | 26 | 6.8% |
| 6th Grade | 31 | 8.2% |
| 7th Grade | 31 | 8.2% |
| 8th Grade | 27 | 7.1% |
| 9th Grade | 39 | 10.3% |
| 10th Grade | 33 | 8.7% |
| 11th Grade | 27 | 7.1% |
| 12th Grade | 12 | 3.2% |
Teacher Education Background (2009)
Percent With Master's Degree
School:
79.2%
District:
80.1%
Percent With Bachelor's Degree
School:
20.8%
District:
16.8%
Teacher Credentials & Experience (2009)
Percent of Teachers With Emergency Credentials: 5.6%
Percent of Teachers With Credentials: 100.0%
Number of Certificated Staff: 24.0
Average Number of Years of Teacher Experience: 18.5
Average Age
School:
49.1
District:
46.6
Source: CA Department of Education, Source: NCES 2009-2010
School Ratings and Reviews
Be The First To Review John Muir School!
Sponsored Links
Test Scores and Performance Information
Overall School Rating
How is this determined?
The overall school rating shows that John Muir School performed on average about the same as other schools across the state on CST state exams in the following subjects:
- CST Algebra I
- CST Algebra II
- CST Biology
- CST Chemistry
- CST Earth Science
- CST English-Language Arts
- CST Geometry
- CST History - Social Science
- CST Integrated Math 1
- CST Mathematics
- CST Science
- CST U.S. History
- CST World History
AYP Results (2010)
Overall AYP Met: No
ELA AYP Met: No
Math AYP Met: No
ACT Exam Results (2009)
Percent of Students Taking ACT Exam: 52.6%
SAT Exam Results (2009)
Percent of Students Taking SAT Exam: 84.2%
Average Combined Score: 1,165.6
Critical Reading Average: 383.1
Math Average: 408.1
Writing Average: 374.4
Percent Scoring At or Above 1500: 6.3%
CST - Test Proficiency by Grade and Subject
Grade 2 - % of students at or above proficiency
| School | District | State | |
|---|---|---|---|
| CST English-Language Arts Test | |||
| 2010 | 46.0% | 57.0% | 53.0% |
| 2009 | 50.0% | 56.0% | 53.0% |
| 2008 | 64.0% | 49.0% | 48.0% |
| CST Mathematics Test | |||
| 2010 | 46.0% | 66.0% | 62.0% |
| 2009 | 52.0% | 65.0% | 63.0% |
| 2008 | 84.0% | 62.0% | 59.0% |
Grade 3 - % of students at or above proficiency
| School | District | State | |
|---|---|---|---|
| CST English-Language Arts Test | |||
| 2010 | 45.0% | 47.0% | 43.0% |
| 2009 | 35.0% | 48.0% | 44.0% |
| 2008 | 29.0% | 40.0% | 38.0% |
| CST Mathematics Test | |||
| 2010 | 65.0% | 68.0% | 65.0% |
| 2009 | 53.0% | 66.0% | 64.0% |
| 2008 | 36.0% | 62.0% | 61.0% |
Grade 4 - % of students at or above proficiency
| School | District | State | |
|---|---|---|---|
| CST English-Language Arts Test | |||
| 2010 | 62.0% | 67.0% | 63.0% |
| 2009 | 63.0% | 64.0% | 61.0% |
| 2008 | 50.0% | 57.0% | 55.0% |
| CST Mathematics Test | |||
| 2010 | 79.0% | 71.0% | 68.0% |
| 2009 | 63.0% | 68.0% | 66.0% |
| 2008 | 73.0% | 61.0% | 61.0% |
Grade 5 - % of students at or above proficiency
| School | District | State | |
|---|---|---|---|
| CST English-Language Arts Test | |||
| 2010 | 43.0% | 64.0% | 58.0% |
| 2009 | 80.0% | 58.0% | 54.0% |
| 2008 | 55.0% | 49.0% | 48.0% |
| CST Mathematics Test | |||
| 2010 | 48.0% | 63.0% | 61.0% |
| 2009 | 74.0% | 60.0% | 57.0% |
| 2008 | 63.0% | 52.0% | 51.0% |
| CST Science Test | |||
| 2010 | 39.0% | 64.0% | 56.0% |
| 2009 | 56.0% | 55.0% | 49.0% |
| 2008 | 45.0% | 46.0% | 46.0% |
Grade 6 - % of students at or above proficiency
| School | District | State | |
|---|---|---|---|
| CST English-Language Arts Test | |||
| 2010 | 61.0% | 60.0% | 55.0% |
| 2009 | 52.0% | 55.0% | 52.0% |
| 2008 | 54.0% | 49.0% | 47.0% |
| CST Mathematics Test | |||
| 2010 | 75.0% | 55.0% | 52.0% |
| 2009 | 60.0% | 50.0% | 49.0% |
| 2008 | 53.0% | 46.0% | 44.0% |
Grade 7 - % of students at or above proficiency
| School | District | State | |
|---|---|---|---|
| CST English-Language Arts Test | |||
| 2010 | 46.0% | 57.0% | 55.0% |
| 2009 | 54.0% | 54.0% | 54.0% |
| 2008 | 65.0% | 49.0% | 49.0% |
| CST Mathematics Test | |||
| 2010 | 54.0% | 49.0% | 48.0% |
| 2009 | 55.0% | 44.0% | 43.0% |
| 2008 | 73.0% | 42.0% | 41.0% |
Grade 8 - % of students at or above proficiency
| School | District | State | |
|---|---|---|---|
| CST Algebra I Test | |||
| 2010 | 30.0% | 41.0% | 46.0% |
| 2009 | 66.0% | 38.0% | 44.0% |
| 2008 | 45.0% | 31.0% | 42.0% |
| CST English-Language Arts Test | |||
| 2010 | 65.0% | 58.0% | 54.0% |
| 2009 | 76.0% | 49.0% | 48.0% |
| 2008 | 59.0% | 48.0% | 45.0% |
| CST History - Social Science Test | |||
| 2010 | 41.0% | 49.0% | 47.0% |
| 2009 | 73.0% | 40.0% | 42.0% |
| 2008 | 44.0% | 37.0% | 36.0% |
| CST Science Test | |||
| 2010 | 43.0% | 62.0% | 59.0% |
| 2009 | 71.0% | 51.0% | 56.0% |
| 2008 | 55.0% | 47.0% | 52.0% |
Grade 9 - % of students at or above proficiency
| School | District | State | |
|---|---|---|---|
| CST Algebra I Test | |||
| 2010 | 5.0% | 15.0% | 22.0% |
| 2009 | 50.0% | 13.0% | 21.0% |
| 2008 | 25.0% | 8.0% | 18.0% |
| CST Earth Science Test | |||
| 2010 | 31.0% | 31.0% | 35.0% |
| 2009 | 22.0% | 23.0% | 29.0% |
| 2008 | 29.0% | 21.0% | 31.0% |
| CST English-Language Arts Test | |||
| 2010 | 58.0% | 58.0% | 54.0% |
| 2009 | 68.0% | 52.0% | 50.0% |
| 2008 | 57.0% | 50.0% | 49.0% |
| CST Geometry Test | |||
| 2010 | 21.0% | 29.0% | 46.0% |
| 2009 | 38.0% | 28.0% | 47.0% |
| 2008 | 27.0% | 26.0% | 43.0% |
Grade 10 - % of students at or above proficiency
| School | District | State | |
|---|---|---|---|
| CST Biology Test | |||
| 2010 | 44.0% | 37.0% | 38.0% |
| 2009 | 36.0% | 33.0% | 34.0% |
| 2008 | 40.0% | 31.0% | 35.0% |
| CST English-Language Arts Test | |||
| 2010 | 53.0% | 48.0% | 45.0% |
| 2009 | 47.0% | 44.0% | 44.0% |
| 2008 | 55.0% | 40.0% | 41.0% |
| CST Geometry Test | |||
| 2010 | 5.0% | 7.0% | 14.0% |
| 2009 | 9.0% | 7.0% | 14.0% |
| CST Science Test | |||
| 2010 | 47.0% | 44.0% | 46.0% |
| 2009 | 35.0% | 40.0% | 44.0% |
| 2008 | 50.0% | 32.0% | 40.0% |
| CST World History Test | |||
| 2010 | 16.0% | 39.0% | 42.0% |
| 2009 | 9.0% | 35.0% | 38.0% |
| 2008 | 28.0% | 29.0% | 33.0% |
Grade 11 - % of students at or above proficiency
| School | District | State | |
|---|---|---|---|
| CST Chemistry Test | |||
| 2010 | 4.0% | 20.0% | 30.0% |
| CST English-Language Arts Test | |||
| 2010 | 44.0% | 45.0% | 42.0% |
| 2009 | 44.0% | 41.0% | 40.0% |
| 2008 | 23.0% | 38.0% | 37.0% |
| CST Integrated Math 1 Test | |||
| 2010 | 8.0% | 9.0% | 11.0% |
| CST U.S. History Test | |||
| 2010 | 32.0% | 47.0% | 45.0% |
| 2009 | 32.0% | 44.0% | 44.0% |
| 2008 | 14.0% | 36.0% | 38.0% |
| CST Biology Test | |||
| 2008 | 10.0% | 43.0% | 39.0% |
End of Course - % of students at or above proficiency
| School | District | State | |
|---|---|---|---|
| CST Algebra I Test | |||
| 2010 | 17.0% | 34.0% | 31.0% |
| 2009 | 56.0% | 30.0% | 28.0% |
| 2008 | 36.0% | 25.0% | 25.0% |
| CST Biology Test | |||
| 2010 | 44.0% | 44.0% | 46.0% |
| 2009 | 36.0% | 40.0% | 42.0% |
| 2008 | 24.0% | 38.0% | 42.0% |
| CST Chemistry Test | |||
| 2010 | 4.0% | 29.0% | 38.0% |
| CST Earth Science Test | |||
| 2010 | 31.0% | 31.0% | 33.0% |
| 2009 | 20.0% | 23.0% | 28.0% |
| 2008 | 29.0% | 21.0% | 28.0% |
| CST Geometry Test | |||
| 2010 | 11.0% | 22.0% | 27.0% |
| 2009 | 21.0% | 21.0% | 26.0% |
| 2008 | 18.0% | 17.0% | 24.0% |
| CST Integrated Math 1 Test | |||
| 2010 | 8.0% | 10.0% | 13.0% |
| CST World History Test | |||
| 2010 | 16.0% | 41.0% | 41.0% |
| 2009 | 9.0% | 38.0% | 38.0% |
| 2008 | 28.0% | 31.0% | 33.0% |
| CST Algebra II Test | |||
| 2009 | 17.0% | 19.0% | 28.0% |
| 2008 | 8.0% | 17.0% | 27.0% |
Source: CA Department of Education 2009-2010
School Map and Similar Schools Nearby
Click to Activate Map of Nearby School Campuses
Private
Public
This School
Similar Schools Nearby
| Clairemont High School 9-12 | 1,451 Students | 1.2 miles away | Not Yet Rated | |
| Madison High School 9-12 | 1,246 Students | 1.3 miles away | ![]() 3 out of 5 | |
| Mission Bay High School 9-12 | 1,622 Students | 2.4 miles away | Not Yet Rated | |
| School of International Business at Kearny High Education 9-12 | 454 Students | 2.5 miles away | Not Yet Rated | |
| University City High School 9-12 | 1,852 Students | 2.8 miles away | ![]() 4 out of 5 | |
| La Jolla High School 9-12 | 1,591 Students | 4.6 miles away | Not Yet Rated | |
| Serra High School 9-12 | 2,087 Students | 5.0 miles away | Not Yet Rated | |
| Point Loma High School 9-12 | 2,115 Students | 6.1 miles away | Not Yet Rated | |
| Mira Mesa High School 9-12 | 2,637 Students | 6.8 miles away | Not Yet Rated | |
| Hoover High School 9-12 | 2,163 Students | 7.2 miles away | Not Yet Rated | |
Compare This School To Nearby Schools ->
School Community Forum

Join a discussion about John Muir School and talk to others in the community including students, parents, teachers, and administrators.
Popular Discussion Topics
- Admissions and Registration Questions (e.g. Dress Code and Discipline Policy)
- School Calendar and Upcoming Events (e.g. Graduation)
- After School Programs, Extracurricular Activities, and Athletics (e.g. Football)
- News and Announcements (e.g. Yearbook and Class Supply List Details)
- Graduate and Alumni Events (e.g. Organizing Class Reunions)
Navigation
Can't Find What You Are Looking For?
Rankings
Nearby Cities
Sponsored Links
K-12 Articles
School Lunches ... Hot or Cold?
First there were four, now there are six, no one knows how many more there may be in the future....
Making Sense of No Child Left Behind
The No Child Left Behind Act of 2001 has met with mixed results and mixed feelings. Some think it...
Democracy in Action
There is still over a year until the general election, but the election cycle has been in full...


