Johnson Elementary School
Rating
Not Available
Not Available

No Reviews Yet
Find Old Friends From Johnson Elementary School
Use the form below to search for alumni from Johnson Elementary School.
School Description
School Summary and Highlights
- Enrolls 515 elementary school students from grades KG-6
- Ranks 2443rd out of 5,423 elementary schools in CA.
- 2010 Overall School AYP Met Status: No
Additional Contact Information
- Mailing Address: 1355 Kelton Rd., San Diego, CA 92114
School Operational Details
- Title I EligibleAll students of this school are eligible for participation in authorized programs.
School District Details
- San Diego Unified School District
- Per-Pupil Spending: $10,305
- Graduation Rate: 63.0%
- Dropout Rate: 2.4%
- Students Per Teacher: 20.1
- Enrolled Students: 131,163
Faculty Details and Student Enrollment
Students and Faculty
- Total Students Enrolled: 515
- Total Full Time "Equivalent" Teachers: 27.2
- Average Student-To-Teacher Ratio: 18.9
Students Gender Breakdown
- Males: 268 (52.0%)
- Females: 247 (48.0%)
Free Lunch Student Eligibility Breakdown
- Eligible for Reduced Lunch: 17 (3.3%)
- Eligible for Free Lunch: 457 (88.7%)
- Eligible for Either Reduced or Free Lunch: 474 (92.0%)
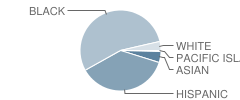
Student Enrollment Distribution by Race / Ethnicity
| Number | Percent | |
|---|---|---|
| American Indian | - | - |
| Black | 272 | 52.8% |
| Asian | 22 | 4.3% |
| Hispanic | 185 | 35.9% |
| White | 18 | 3.5% |
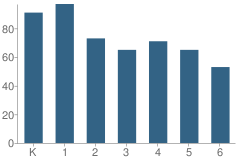
Number of Students Per Grade
| Number | Percent | |
|---|---|---|
| Kindergarten | 91 | 17.7% |
| 1st Grade | 97 | 18.8% |
| 2nd Grade | 73 | 14.2% |
| 3rd Grade | 65 | 12.6% |
| 4th Grade | 71 | 13.8% |
| 5th Grade | 65 | 12.6% |
| 6th Grade | 53 | 10.3% |
Teacher Education Background (2009)
Percent With Master's Degree
School:
63.0%
District:
80.1%
Percent With Bachelor's Degree
School:
37.0%
District:
16.8%
Teacher Credentials & Experience (2009)
Percent of Teachers With Credentials: 100.0%
Number of Certificated Staff: 27.0
Average Number of Years of Teacher Experience: 16.7
Average Age
School:
44.8
District:
46.6
Source: CA Department of Education, Source: NCES 2009-2010
School Ratings and Reviews
Be The First To Review Johnson Elementary School!
School Map and Similar Schools Nearby
Click to Activate Map of Nearby School Campuses
Private
Public
This School
Similar Schools Nearby
| Horton Elementary School KG-6 | 528 Students | 0.9 miles away | Not Yet Rated | |
| Encanto Elementary School KG-5 | 616 Students | 0.9 miles away | Not Yet Rated | |
| Oak Park Elementary School KG-5 | 728 Students | 1.0 miles away | Not Yet Rated | |
| Webster Elementary School KG-6 | 460 Students | 1.1 miles away | Not Yet Rated | |
| Valencia Park Elementary School KG-5 | 556 Students | 1.1 miles away | Not Yet Rated | |
| Carver Elementary School KG-8 | 280 Students | 1.4 miles away | Not Yet Rated | |
| Chollas / Mead Elementary School KG-6 | 811 Students | 1.5 miles away | Not Yet Rated | |
| Nye Elementary School KG-5 | 595 Students | 1.7 miles away | Not Yet Rated | |
| Walter J. Porter Elementary School KG-6 | 760 Students | 1.7 miles away |  5 out of 5 | |
| Marshall Elementary School KG-5 | 536 Students | 1.8 miles away | Not Yet Rated | |
Compare This School To Nearby Schools ->
School Community Forum

Join a discussion about Johnson Elementary School and talk to others in the community including students, parents, teachers, and administrators.
Popular Discussion Topics
- Admissions and Registration Questions (e.g. Dress Code and Discipline Policy)
- School Calendar and Upcoming Events (e.g. Graduation)
- After School Programs, Extracurricular Activities, and Athletics (e.g. Football)
- News and Announcements (e.g. Yearbook and Class Supply List Details)
- Graduate and Alumni Events (e.g. Organizing Class Reunions)
Navigation
Can't Find What You Are Looking For?
Rankings
Nearby Cities
Sponsored Links
K-12 Articles

Kids and Competition
In the backyard, the classroom, the community and while participating in sports and other...
In the backyard, the classroom, the community and while participating in sports and other...

Is Your Child Happy at School?
As a parent, you’d love to have your child share all of his feelings with you. It would be so easy...
As a parent, you’d love to have your child share all of his feelings with you. It would be so easy...

Preparing Your Child for the First Day of School
It seems like school was just dismissed for the summer, yet here we are facing another year of back...
It seems like school was just dismissed for the summer, yet here we are facing another year of back...