La Jolla High School

No Reviews Yet
Find Old Friends From La Jolla High School
Use the form below to search for alumni from La Jolla High School.
School Description
School Summary and Highlights
- Enrolls 1,591 high school students from grades 9-12
- Ranks 325th out of 1,197 high schools in CA.
- 2010 Overall School AYP Met Status: No
Additional Contact Information
- Mailing Address: 750 Nautilus St., La Jolla, CA 92037
School District Details
- San Diego Unified School District
- Per-Pupil Spending: $10,305
- Graduation Rate: 63.0%
- Dropout Rate: 2.4%
- Students Per Teacher: 20.1
- Enrolled Students: 131,163
Faculty Details and Student Enrollment
Students and Faculty
- Total Students Enrolled: 1,591
- Total Full Time "Equivalent" Teachers: 66.2
- Average Student-To-Teacher Ratio: 24.0
Students Gender Breakdown
- Males: 791 (49.7%)
- Females: 800 (50.3%)
Free Lunch Student Eligibility Breakdown
- Eligible for Reduced Lunch: 57 (3.6%)
- Eligible for Free Lunch: 358 (22.5%)
- Eligible for Either Reduced or Free Lunch: 415 (26.1%)
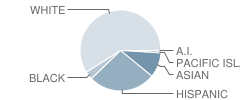
Student Enrollment Distribution by Race / Ethnicity

| Number | Percent | |
|---|---|---|
| American Indian | 6 | 0.4% |
| Black | 53 | 3.3% |
| Asian | 158 | 9.9% |
| Hispanic | 424 | 26.6% |
| White | 930 | 58.5% |
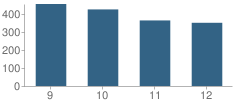
Number of Students Per Grade

| Number | Percent | |
|---|---|---|
| 9th Grade | 454 | 28.5% |
| 10th Grade | 424 | 26.6% |
| 11th Grade | 363 | 22.8% |
| 12th Grade | 350 | 22.0% |
Graduates Information (2010)
Graduation Rate
School:
95.5%
District:
79.3%
State:
78.6%
Teacher Education Background (2009)
Percent With Master's Degree
School:
73.1%
District:
80.1%
Percent With Bachelor's Degree
School:
25.6%
District:
16.8%
Teacher Credentials & Experience (2009)
Percent of Teachers With Credentials: 100.0%
Number of Certificated Staff: 78.0
Average Number of Years of Teacher Experience: 18.1
Average Age
School:
46.9
District:
46.6
Source: CA Department of Education, Source: NCES 2009-2010
School Ratings and Reviews
Be The First To Review La Jolla High School!
Sponsored Links
Test Scores and Performance Information
Overall School Rating
How is this determined?
The overall school rating shows that La Jolla High School performed on average better than many other schools across the state on CST state exams in the following subjects:
- CST Algebra I
- CST Algebra II
- CST Biology
- CST Chemistry
- CST Earth Science
- CST English-Language Arts
- CST Geometry
- CST Integrated Math 1
- CST Physics
- CST Science
- CST Summative High School Math
- CST U.S. History
- CST World History
AYP Results (2010)
Overall AYP Met: No
ELA AYP Met: Yes
Math AYP Met: No
ACT Exam Results (2009)
Percent of Students Taking ACT Exam: 46.7%
Average Combined Score: 26.0
Percent Scoring At or Above 21: 83.4%
SAT Exam Results (2009)
Percent of Students Taking SAT Exam: 77.9%
Average Combined Score: 1,724.4
Critical Reading Average: 573.3
Math Average: 583.1
Writing Average: 568.0
Percent Scoring At or Above 1500: 75.3%
CST - Test Proficiency by Grade and Subject
Grade 9 - % of students at or above proficiency
| School | District | State | |
|---|---|---|---|
| CST Algebra I Test | |||
| 2010 | 4.0% | 15.0% | 22.0% |
| 2009 | 6.0% | 13.0% | 21.0% |
| 2008 | 9.0% | 8.0% | 18.0% |
| CST Algebra II Test | |||
| 2010 | 96.0% | 59.0% | 69.0% |
| 2009 | 73.0% | 49.0% | 65.0% |
| 2008 | 83.0% | 50.0% | 66.0% |
| CST Biology Test | |||
| 2010 | 67.0% | 58.0% | 55.0% |
| 2009 | 66.0% | 55.0% | 51.0% |
| 2008 | 69.0% | 59.0% | 52.0% |
| CST English-Language Arts Test | |||
| 2010 | 76.0% | 58.0% | 54.0% |
| 2009 | 77.0% | 52.0% | 50.0% |
| 2008 | 77.0% | 50.0% | 49.0% |
| CST Geometry Test | |||
| 2010 | 41.0% | 29.0% | 46.0% |
| 2009 | 37.0% | 28.0% | 47.0% |
| 2008 | 43.0% | 26.0% | 43.0% |
| CST Summative High School Math Test | |||
| 2010 | 91.0% | 92.0% | 87.0% |
| CST World History Test | |||
| 2010 | 72.0% | 57.0% | 45.0% |
| 2009 | 70.0% | 59.0% | 41.0% |
| 2008 | 57.0% | 57.0% | 36.0% |
| CST Physics Test | |||
| 2009 | 67.0% | 36.0% | 35.0% |
Grade 10 - % of students at or above proficiency
| School | District | State | |
|---|---|---|---|
| CST Algebra I Test | |||
| 2010 | 4.0% | 9.0% | 12.0% |
| CST Algebra II Test | |||
| 2010 | 26.0% | 25.0% | 40.0% |
| 2009 | 24.0% | 22.0% | 37.0% |
| 2008 | 19.0% | 20.0% | 36.0% |
| CST Biology Test | |||
| 2010 | 74.0% | 37.0% | 38.0% |
| 2009 | 71.0% | 33.0% | 34.0% |
| 2008 | 67.0% | 31.0% | 35.0% |
| CST Chemistry Test | |||
| 2010 | 49.0% | 48.0% | 47.0% |
| 2009 | 56.0% | 36.0% | 44.0% |
| 2008 | 48.0% | 31.0% | 41.0% |
| CST English-Language Arts Test | |||
| 2010 | 71.0% | 48.0% | 45.0% |
| 2009 | 70.0% | 44.0% | 44.0% |
| 2008 | 68.0% | 40.0% | 41.0% |
| CST Geometry Test | |||
| 2010 | 9.0% | 7.0% | 14.0% |
| 2009 | 2.0% | 7.0% | 14.0% |
| 2008 | 12.0% | 5.0% | 12.0% |
| CST Physics Test | |||
| 2010 | 49.0% | 35.0% | 44.0% |
| 2009 | 40.0% | 23.0% | 40.0% |
| 2008 | 42.0% | 24.0% | 36.0% |
| CST Science Test | |||
| 2010 | 73.0% | 44.0% | 46.0% |
| 2009 | 72.0% | 40.0% | 44.0% |
| 2008 | 64.0% | 32.0% | 40.0% |
| CST Summative High School Math Test | |||
| 2010 | 79.0% | 61.0% | 75.0% |
| 2009 | 86.0% | 63.0% | 71.0% |
| 2008 | 85.0% | 60.0% | 68.0% |
| CST World History Test | |||
| 2010 | 72.0% | 39.0% | 42.0% |
| 2009 | 53.0% | 35.0% | 38.0% |
| 2008 | 47.0% | 29.0% | 33.0% |
| CST Integrated Math 1 Test | |||
| 2009 | 9.0% | 16.0% | 9.0% |
| 2008 | 18.0% | 17.0% | 10.0% |
Grade 11 - % of students at or above proficiency
| School | District | State | |
|---|---|---|---|
| CST Algebra II Test | |||
| 2010 | 6.0% | 6.0% | 14.0% |
| 2009 | 2.0% | 4.0% | 12.0% |
| 2008 | 7.0% | 3.0% | 11.0% |
| CST Biology Test | |||
| 2010 | 73.0% | 58.0% | 46.0% |
| 2009 | 82.0% | 50.0% | 41.0% |
| 2008 | 78.0% | 43.0% | 39.0% |
| CST Chemistry Test | |||
| 2010 | 47.0% | 20.0% | 30.0% |
| 2009 | 60.0% | 14.0% | 27.0% |
| 2008 | 62.0% | 15.0% | 25.0% |
| CST Earth Science Test | |||
| 2010 | 73.0% | 37.0% | 32.0% |
| 2009 | 73.0% | 25.0% | 26.0% |
| CST English-Language Arts Test | |||
| 2010 | 71.0% | 45.0% | 42.0% |
| 2009 | 73.0% | 41.0% | 40.0% |
| 2008 | 70.0% | 38.0% | 37.0% |
| CST Integrated Math 1 Test | |||
| 2010 | 4.0% | 9.0% | 11.0% |
| 2009 | 7.0% | 9.0% | 9.0% |
| CST Physics Test | |||
| 2010 | 48.0% | 26.0% | 53.0% |
| 2009 | 31.0% | 31.0% | 50.0% |
| 2008 | 40.0% | 30.0% | 47.0% |
| CST Summative High School Math Test | |||
| 2010 | 51.0% | 35.0% | 50.0% |
| 2009 | 44.0% | 32.0% | 47.0% |
| 2008 | 49.0% | 30.0% | 43.0% |
| CST U.S. History Test | |||
| 2010 | 70.0% | 47.0% | 45.0% |
| 2009 | 73.0% | 44.0% | 44.0% |
| 2008 | 67.0% | 36.0% | 38.0% |
| CST Geometry Test | |||
| 2008 | 10.0% | 2.0% | 6.0% |
| CST World History Test | |||
| 2008 | 30.0% | 12.0% | 9.0% |
End of Course - % of students at or above proficiency
| School | District | State | |
|---|---|---|---|
| CST Algebra I Test | |||
| 2010 | 4.0% | 34.0% | 31.0% |
| 2009 | 5.0% | 30.0% | 28.0% |
| 2008 | 6.0% | 25.0% | 25.0% |
| CST Algebra II Test | |||
| 2010 | 33.0% | 22.0% | 31.0% |
| 2009 | 30.0% | 19.0% | 28.0% |
| 2008 | 26.0% | 17.0% | 27.0% |
| CST Biology Test | |||
| 2010 | 70.0% | 44.0% | 46.0% |
| 2009 | 69.0% | 40.0% | 42.0% |
| 2008 | 70.0% | 38.0% | 42.0% |
| CST Chemistry Test | |||
| 2010 | 49.0% | 29.0% | 38.0% |
| 2009 | 58.0% | 23.0% | 36.0% |
| 2008 | 56.0% | 26.0% | 32.0% |
| CST Earth Science Test | |||
| 2010 | 73.0% | 31.0% | 33.0% |
| 2009 | 69.0% | 23.0% | 28.0% |
| CST Geometry Test | |||
| 2010 | 31.0% | 22.0% | 27.0% |
| 2009 | 27.0% | 21.0% | 26.0% |
| 2008 | 34.0% | 17.0% | 24.0% |
| CST Integrated Math 1 Test | |||
| 2010 | 2.0% | 10.0% | 13.0% |
| 2009 | 8.0% | 11.0% | 11.0% |
| 2008 | 6.0% | 9.0% | 11.0% |
| CST Physics Test | |||
| 2010 | 49.0% | 44.0% | 49.0% |
| 2009 | 37.0% | 34.0% | 46.0% |
| 2008 | 42.0% | 31.0% | 43.0% |
| CST Summative High School Math Test | |||
| 2010 | 58.0% | 39.0% | 54.0% |
| 2009 | 53.0% | 37.0% | 50.0% |
| 2008 | 58.0% | 34.0% | 47.0% |
| CST World History Test | |||
| 2010 | 72.0% | 41.0% | 41.0% |
| 2009 | 63.0% | 38.0% | 38.0% |
| 2008 | 51.0% | 31.0% | 33.0% |
Source: CA Department of Education 2009-2010
School Map and Similar Schools Nearby
Click to Activate Map of Nearby School Campuses
Private
Public
This School
Similar Schools Nearby
| Mission Bay High School 9-12 | 1,622 Students | 3.7 miles away | Not Yet Rated | |
| University City High School 9-12 | 1,852 Students | 4.1 miles away | ![]() 4 out of 5 | |
| Clairemont High School 9-12 | 1,451 Students | 4.5 miles away | Not Yet Rated | |
| John Muir School KG-12 | 380 Students | 4.6 miles away | Not Yet Rated | |
| Madison High School 9-12 | 1,246 Students | 5.8 miles away | ![]() 3 out of 5 | |
| School of International Business at Kearny High Education 9-12 | 454 Students | 6.9 miles away | Not Yet Rated | |
| Point Loma High School 9-12 | 2,115 Students | 7.1 miles away | Not Yet Rated | |
| Torrey Pines High School 9-12 | 2,629 Students | 9.1 miles away | Not Yet Rated | |
| Mira Mesa High School 9-12 | 2,637 Students | 9.3 miles away | Not Yet Rated | |
| Serra High School 9-12 | 2,087 Students | 9.6 miles away | Not Yet Rated | |
Compare This School To Nearby Schools ->
School Community Forum

Join a discussion about La Jolla High School and talk to others in the community including students, parents, teachers, and administrators.
Popular Discussion Topics
- Admissions and Registration Questions (e.g. Dress Code and Discipline Policy)
- School Calendar and Upcoming Events (e.g. Graduation)
- After School Programs, Extracurricular Activities, and Athletics (e.g. Football)
- News and Announcements (e.g. Yearbook and Class Supply List Details)
- Graduate and Alumni Events (e.g. Organizing Class Reunions)
Navigation
Can't Find What You Are Looking For?
Rankings
Sponsored Links
K-12 Articles
Se Hablan Otras Idiomas?
In the late 1990s, the Salem-Keizer school district in Oregon began requiring every student in its...
Teaching Your Child Study Skills
Many children who have the capability to get good grades experience frustration because of low...
Breakfast, Kids and Learning
For generations parents have been telling their kids that breakfast is the most important meal of...


