Longfellow Elementary School
Rating
Not Available
Not Available

No Reviews Yet
Find Old Friends From Longfellow Elementary School
Use the form below to search for alumni from Longfellow Elementary School.
School Description
School Summary and Highlights
- Enrolls 691 elementary school students from grades KG-8
- Ranks 206th out of 2,050 middle schools in CA.
- 2010 Overall School AYP Met Status: Yes
Additional Contact Information
- Mailing Address: 5055 July St., San Diego, CA 92110
School Operational Details
- Title I EligibleAll students of this school are eligible for participation in authorized programs.
School District Details
- San Diego Unified School District
- Per-Pupil Spending: $10,305
- Graduation Rate: 63.0%
- Dropout Rate: 2.4%
- Students Per Teacher: 20.1
- Enrolled Students: 131,163
Faculty Details and Student Enrollment
Students and Faculty
- Total Students Enrolled: 691
- Total Full Time "Equivalent" Teachers: 35.9
- Average Student-To-Teacher Ratio: 19.3
Students Gender Breakdown
- Males: 296 (42.8%)
- Females: 395 (57.2%)
Free Lunch Student Eligibility Breakdown
- Eligible for Reduced Lunch: 115 (16.6%)
- Eligible for Free Lunch: 235 (34.0%)
- Eligible for Either Reduced or Free Lunch: 350 (50.7%)
Student Enrollment Distribution by Race / Ethnicity
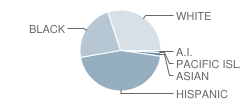
| Number | Percent | |
|---|---|---|
| American Indian | 5 | 0.7% |
| Black | 149 | 21.6% |
| Asian | 10 | 1.4% |
| Hispanic | 295 | 42.7% |
| White | 197 | 28.5% |
Number of Students Per Grade
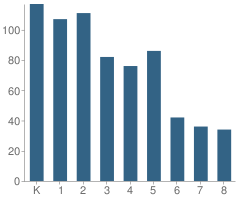
| Number | Percent | |
|---|---|---|
| Kindergarten | 117 | 16.9% |
| 1st Grade | 107 | 15.5% |
| 2nd Grade | 111 | 16.1% |
| 3rd Grade | 82 | 11.9% |
| 4th Grade | 76 | 11.0% |
| 5th Grade | 86 | 12.4% |
| 6th Grade | 42 | 6.1% |
| 7th Grade | 36 | 5.2% |
| 8th Grade | 34 | 4.9% |
Teacher Education Background (2009)
Percent With Ph.D.
School:
2.4%
District:
2.0%
Percent With Master's Degree
School:
47.6%
District:
80.1%
Percent With Bachelor's Degree
School:
50.0%
District:
16.8%
Teacher Credentials & Experience (2009)
Percent of Teachers With Credentials: 97.4%
Number of Certificated Staff: 42.0
Average Number of Years of Teacher Experience: 15.0
Average Age
School:
43.0
District:
46.6
Source: CA Department of Education, Source: NCES 2009-2010
School Ratings and Reviews
Be The First To Review Longfellow Elementary School!
School Map and Similar Schools Nearby
Click to Activate Map of Nearby School Campuses
Private
Public
This School
Similar Schools Nearby
| Bay Park Elementary School KG-5 | 480 Students | 0.9 miles away | Not Yet Rated | |
| Linda Vista Elementary School KG-5 | 513 Students | 1.1 miles away | Not Yet Rated | |
| Carson Elementary School KG-5 | 517 Students | 1.1 miles away | Not Yet Rated | |
| Chesterton Elementary School KG-5 | 507 Students | 1.7 miles away | Not Yet Rated | |
| Toler Elementary School KG-5 | 289 Students | 1.8 miles away | Not Yet Rated | |
| Fletcher Elementary School KG-5 | 277 Students | 1.8 miles away | Not Yet Rated | |
| Holmes Elementary School KG-6 | 492 Students | 2.0 miles away | Not Yet Rated | |
| Bayview Terrace Elementary School KG-5 | 234 Students | 2.4 miles away | Not Yet Rated | |
| Grant Elementary School KG-8 | 621 Students | 2.4 miles away | Not Yet Rated | |
| Ross Elementary School KG-5 | 380 Students | 2.6 miles away | Not Yet Rated | |
Compare This School To Nearby Schools ->
School Community Forum

Join a discussion about Longfellow Elementary School and talk to others in the community including students, parents, teachers, and administrators.
Popular Discussion Topics
- Admissions and Registration Questions (e.g. Dress Code and Discipline Policy)
- School Calendar and Upcoming Events (e.g. Graduation)
- After School Programs, Extracurricular Activities, and Athletics (e.g. Football)
- News and Announcements (e.g. Yearbook and Class Supply List Details)
- Graduate and Alumni Events (e.g. Organizing Class Reunions)
Navigation
Can't Find What You Are Looking For?
Rankings
Nearby Cities
Sponsored Links
K-12 Articles

Public or Private?
Daniel attended private school until sixth grade, when he was diagnosed with Asperger’s Syndrome, a...
Daniel attended private school until sixth grade, when he was diagnosed with Asperger’s Syndrome, a...

Transform Your Middle School Slacker into a Scholar
All children need motivation to learn. Have your child’s grades decreased since he started middle...
All children need motivation to learn. Have your child’s grades decreased since he started middle...

Imho
I was watching Headline News’s news ticker when I read something that made me LOL. The ticker said...
I was watching Headline News’s news ticker when I read something that made me LOL. The ticker said...