Madison High School
Rating
Not Available
Not Available

3 out of 5 | 2 Reviews
Find Old Friends From Madison High School
Use the form below to search for alumni from Madison High School.
School Description
School Summary and Highlights
- Enrolls 1,246 high school students from grades 9-12
- Ranks 875th out of 1,197 high schools in CA.
- 2010 Overall School AYP Met Status: No
Additional Contact Information
- Mailing Address: 4833 Doliva Dr., San Diego, CA 92117
School Operational Details
- Title I EligibleAll students of this school are eligible for participation in authorized programs.
School District Details
- San Diego Unified School District
- Per-Pupil Spending: $10,305
- Graduation Rate: 63.0%
- Dropout Rate: 2.4%
- Students Per Teacher: 20.1
- Enrolled Students: 131,163
Faculty Details and Student Enrollment
Students and Faculty
- Total Students Enrolled: 1,246
- Total Full Time "Equivalent" Teachers: 66.0
- Average Student-To-Teacher Ratio: 18.9
Students Gender Breakdown
- Males: 689 (55.3%)
- Females: 557 (44.7%)
Free Lunch Student Eligibility Breakdown
- Eligible for Reduced Lunch: 57 (4.6%)
- Eligible for Free Lunch: 870 (69.8%)
- Eligible for Either Reduced or Free Lunch: 927 (74.4%)
Student Enrollment Distribution by Race / Ethnicity
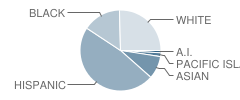
| Number | Percent | |
|---|---|---|
| American Indian | 16 | 1.3% |
| Black | 190 | 15.2% |
| Asian | 115 | 9.2% |
| Hispanic | 582 | 46.7% |
| White | 312 | 25.0% |
Number of Students Per Grade
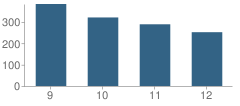
| Number | Percent | |
|---|---|---|
| 9th Grade | 384 | 30.8% |
| 10th Grade | 321 | 25.8% |
| 11th Grade | 289 | 23.2% |
| 12th Grade | 252 | 20.2% |
Graduates Information (2010)
Graduation Rate
School:
86.2%
District:
79.3%
State:
78.6%
Teacher Education Background (2009)
Percent With Master's Degree
School:
65.4%
District:
80.1%
Percent With Bachelor's Degree
School:
32.1%
District:
16.8%
Percent With Ph.D.
School:
1.2%
District:
2.0%
Teacher Credentials & Experience (2009)
Average Age
School:
43.7
District:
46.6
Average Number of Years of Teacher Experience: 13.7
Number of Certificated Staff: 81.0
Percent of Teachers With Credentials: 100.0%
Percent of Teachers With Emergency Credentials: 1.4%
Source: CA Department of Education, Source: NCES 2009-2010
School Ratings and Reviews
Overall Rating: 3

3 out of 5 | 2 Reviews
The Overall Rating is the school's average rating from parents, students, school faculty and staff. The highest rating is five apples and the lowest is one apple.
Share Your Review About This School
2 reviews for Madison High School
- Reviewed by Parent or Guardian on January 03, 2012
- Rating:
 (5 / 5) Flag as inappropriate
 - This is great school. the teachers are nice. Cross Country and Track rocked! It was awesome.
- Reviewed by Student on October 27, 2009
- Rating:
 (1 / 5) Flag as inappropriate
 - this school is very bad school
School Map and Similar Schools Nearby
Click to Activate Map of Nearby School Campuses
Private
Public
This School
Similar Schools Nearby
| John Muir School KG-12 | 380 Students | 1.3 miles away | Not Yet Rated | |
| School of International Business at Kearny High Education 9-12 | 454 Students | 2.3 miles away | Not Yet Rated | |
| Clairemont High School 9-12 | 1,451 Students | 2.4 miles away | Not Yet Rated | |
| University City High School 9-12 | 1,852 Students | 3.0 miles away | Not Yet Rated | |
| Mission Bay High School 9-12 | 1,622 Students | 3.6 miles away | Not Yet Rated | |
| Serra High School 9-12 | 2,087 Students | 3.8 miles away | Not Yet Rated | |
| La Jolla High School 9-12 | 1,591 Students | 5.8 miles away | Not Yet Rated | |
| Mira Mesa High School 9-12 | 2,637 Students | 5.8 miles away | Not Yet Rated | |
| Scripps Ranch High School 9-12 | 2,390 Students | 6.4 miles away | Not Yet Rated | |
| Hoover High School 9-12 | 2,163 Students | 6.7 miles away | Not Yet Rated | |
Compare This School To Nearby Schools ->
School Community Forum

Join a discussion about Madison High School and talk to others in the community including students, parents, teachers, and administrators.
Popular Discussion Topics
- Admissions and Registration Questions (e.g. Dress Code and Discipline Policy)
- School Calendar and Upcoming Events (e.g. Graduation)
- After School Programs, Extracurricular Activities, and Athletics (e.g. Football)
- News and Announcements (e.g. Yearbook and Class Supply List Details)
- Graduate and Alumni Events (e.g. Organizing Class Reunions)
Navigation
Can't Find What You Are Looking For?
Rankings
Nearby Cities
Sponsored Links
K-12 Articles

What to Do when Your Student is Held Back
Kids develop at different speeds, and everyone has different skills and abilities. School is easy...
Kids develop at different speeds, and everyone has different skills and abilities. School is easy...

Siblings and Individual Identity in High School
When the first day of high school looms in the near future, teens are both excited and anxious....
When the first day of high school looms in the near future, teens are both excited and anxious....

The Very Best Things in the World
A recent poll in the U.K. revealed that children view the “very best thing in the world” as being...
A recent poll in the U.K. revealed that children view the “very best thing in the world” as being...