Taft Middle School
Rating
Not Available
Not Available

No Reviews Yet
Find Old Friends From Taft Middle School
Use the form below to search for alumni from Taft Middle School.
School Description
School Summary and Highlights
- Enrolls 606 middle school students from grades 6-8
- Ranks 1142nd out of 2,050 middle schools in CA.
- 2010 Overall School AYP Met Status: Yes
Additional Contact Information
- Mailing Address: 9191 Gramercy Dr., San Diego, CA 92123
School Operational Details
- Title I EligibleAll students of this school are eligible for participation in authorized programs.
School District Details
- San Diego Unified School District
- Per-Pupil Spending: $10,305
- Graduation Rate: 63.0%
- Dropout Rate: 2.4%
- Students Per Teacher: 20.1
- Enrolled Students: 131,163
Faculty Details and Student Enrollment
Students and Faculty
- Total Students Enrolled: 606
- Total Full Time "Equivalent" Teachers: 37.4
- Average Student-To-Teacher Ratio: 16.2
Students Gender Breakdown
- Males: 317 (52.3%)
- Females: 289 (47.7%)
Free Lunch Student Eligibility Breakdown
- Eligible for Reduced Lunch: 81 (13.4%)
- Eligible for Free Lunch: 395 (65.2%)
- Eligible for Either Reduced or Free Lunch: 476 (78.5%)
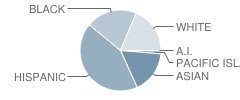
Student Enrollment Distribution by Race / Ethnicity
| Number | Percent | |
|---|---|---|
| American Indian | 2 | 0.3% |
| Black | 119 | 19.6% |
| Asian | 99 | 16.3% |
| Hispanic | 249 | 41.1% |
| White | 109 | 18.0% |
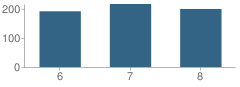
Number of Students Per Grade
| Number | Percent | |
|---|---|---|
| 6th Grade | 191 | 31.5% |
| 7th Grade | 216 | 35.6% |
| 8th Grade | 199 | 32.8% |
Teacher Education Background (2009)
Percent With Master's Degree
School:
77.3%
District:
80.1%
Percent With Bachelor's Degree
School:
22.7%
District:
16.8%
Teacher Credentials & Experience (2009)
Percent of Teachers With Credentials: 97.4%
Number of Certificated Staff: 44.0
Average Number of Years of Teacher Experience: 14.7
Average Age
School:
45.0
District:
46.6
Source: CA Department of Education, Source: NCES 2009-2010
School Ratings and Reviews
Be The First To Review Taft Middle School!
School Map and Similar Schools Nearby
Click to Activate Map of Nearby School Campuses
Private
Public
This School
Similar Schools Nearby
| Farb Middle School 6-8 | 728 Students | 2.2 miles away | Not Yet Rated | |
| Lindbergh / Schweitzer Elementary School KG-6 | 610 Students | 2.6 miles away | Not Yet Rated | |
| Montgomery Middle School 6-8 | 475 Students | 2.6 miles away | Not Yet Rated | |
| Lafayette Elementary School KG-6 | 316 Students | 2.8 miles away | Not Yet Rated | |
| De Portola (Gasper) Middle School 6-8 | 1,020 Students | 2.9 miles away | Not Yet Rated | |
| Lewis Middle School 6-8 | 1,096 Students | 3.0 miles away |  5 out of 5 | |
| Sequoia Elementary School KG-6 | 251 Students | 3.4 miles away | Not Yet Rated | |
| Wilson Middle School 6-8 | 622 Students | 3.4 miles away | Not Yet Rated | |
| Holmes Elementary School KG-6 | 492 Students | 3.5 miles away | Not Yet Rated | |
| Longfellow Elementary School KG-8 | 691 Students | 3.6 miles away | Not Yet Rated | |
Compare This School To Nearby Schools ->
School Community Forum

Join a discussion about Taft Middle School and talk to others in the community including students, parents, teachers, and administrators.
Popular Discussion Topics
- Admissions and Registration Questions (e.g. Dress Code and Discipline Policy)
- School Calendar and Upcoming Events (e.g. Graduation)
- After School Programs, Extracurricular Activities, and Athletics (e.g. Football)
- News and Announcements (e.g. Yearbook and Class Supply List Details)
- Graduate and Alumni Events (e.g. Organizing Class Reunions)
Navigation
Can't Find What You Are Looking For?
Rankings
Sponsored Links
K-12 Articles

How to Get the Best Supplies for Your Money
School supply lists can seem unending, and the price can add up very quickly. But do we really...
School supply lists can seem unending, and the price can add up very quickly. But do we really...

The First Day of School
The first day of kindergarten is a rite of passage for any student. Every mother cries and...
The first day of kindergarten is a rite of passage for any student. Every mother cries and...

It's the Most Wonderful Time of the Year!
For most of the country, school is starting up this week or later this month-at the beginning of...
For most of the country, school is starting up this week or later this month-at the beginning of...