San Diego School of Creative and Performing Art

No Reviews Yet
Find Old Friends From San Diego School of Creative and Performing Art
Use the form below to search for alumni from San Diego School of Creative and Performing Art.
School Description
School Summary and Highlights
- Enrolls 1,427 middle and high school students from grades 6-12
- Ranks 637th out of 1,197 high schools in CA.
- 2010 Overall School AYP Met Status: No
Additional Contact Information
- Mailing Address: 2425 Dusk Dr., San Diego, CA 92139
School Operational Details
- Title I EligibleAll students of this school are eligible for participation in authorized programs.
School District Details
- San Diego Unified School District
- Per-Pupil Spending: $10,305
- Graduation Rate: 63.0%
- Dropout Rate: 2.4%
- Students Per Teacher: 20.1
- Enrolled Students: 131,163
Faculty Details and Student Enrollment
Students and Faculty
- Total Students Enrolled: 1,427
- Total Full Time "Equivalent" Teachers: 63.7
- Average Student-To-Teacher Ratio: 22.4
Students Gender Breakdown
- Males: 533 (37.4%)
- Females: 894 (62.6%)
Free Lunch Student Eligibility Breakdown
- Eligible for Reduced Lunch: 151 (10.6%)
- Eligible for Free Lunch: 626 (43.9%)
- Eligible for Either Reduced or Free Lunch: 777 (54.4%)
Student Enrollment Distribution by Race / Ethnicity
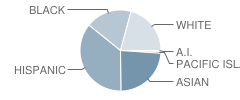
| Number | Percent | |
|---|---|---|
| American Indian | 8 | 0.6% |
| Black | 257 | 18.0% |
| Asian | 331 | 23.2% |
| Hispanic | 500 | 35.0% |
| White | 290 | 20.3% |
Number of Students Per Grade
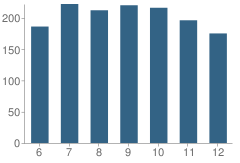
| Number | Percent | |
|---|---|---|
| 6th Grade | 186 | 13.0% |
| 7th Grade | 222 | 15.6% |
| 8th Grade | 212 | 14.9% |
| 9th Grade | 220 | 15.4% |
| 10th Grade | 216 | 15.1% |
| 11th Grade | 196 | 13.7% |
| 12th Grade | 175 | 12.3% |
Graduates Information (2010)
Graduation Rate
School:
92.8%
District:
79.3%
State:
78.6%
Teacher Education Background (2009)
Percent With Ph.D.
School:
2.7%
District:
2.0%
Percent With Master's Degree
School:
50.0%
District:
80.1%
Percent With Bachelor's Degree
School:
47.3%
District:
16.8%
Teacher Credentials & Experience (2009)
Percent of Teachers With Emergency Credentials: 2.9%
Percent of Teachers With Credentials: 97.1%
Number of Certificated Staff: 74.0
Average Number of Years of Teacher Experience: 14.5
Average Age
School:
44.8
District:
46.6
Source: CA Department of Education, Source: NCES 2009-2010
School Ratings and Reviews
Be The First To Review San Diego School of Creative and Performing Art!
Sponsored Links
Test Scores and Performance Information
Overall School Rating
How is this determined?
The overall school rating shows that San Diego School of Creative and Performing Art performed on average about the same as other schools across the state on CST state exams in the following subjects:
- CST Algebra I
- CST Algebra II
- CST Biology
- CST Chemistry
- CST Earth Science
- CST English-Language Arts
- CST General Mathematics
- CST Geometry
- CST History - Social Science
- CST Mathematics
- CST Physics
- CST Science
- CST Summative High School Math
- CST U.S. History
- CST World History
AYP Results (2010)
Overall AYP Met: No
ELA AYP Met: Yes
Math AYP Met: No
Program Improvement (PI) Requirement Under NCLB (2010)
First Year PI Requirement was Implemented: 2009-2010
School's Placement Under NCLB: Year 2
ACT Exam Results (2009)
Percent of Students Taking ACT Exam: 15.8%
Average Combined Score: 21.2
Percent Scoring At or Above 21: 43.3%
SAT Exam Results (2009)
Percent of Students Taking SAT Exam: 61.1%
Average Combined Score: 1,459.9
Critical Reading Average: 493.3
Math Average: 480.0
Writing Average: 486.6
Percent Scoring At or Above 1500: 40.5%
CST - Test Proficiency by Grade and Subject
Grade 6 - % of students at or above proficiency
| School | District | State | |
|---|---|---|---|
| CST English-Language Arts Test | |||
| 2010 | 65.0% | 60.0% | 55.0% |
| 2009 | 57.0% | 55.0% | 52.0% |
| 2008 | 62.0% | 49.0% | 47.0% |
| CST Mathematics Test | |||
| 2010 | 52.0% | 55.0% | 52.0% |
| 2009 | 45.0% | 50.0% | 49.0% |
| 2008 | 51.0% | 46.0% | 44.0% |
Grade 7 - % of students at or above proficiency
| School | District | State | |
|---|---|---|---|
| CST Algebra I Test | |||
| 2010 | 81.0% | 82.0% | 84.0% |
| 2009 | 67.0% | 86.0% | 81.0% |
| 2008 | 58.0% | 89.0% | 80.0% |
| CST English-Language Arts Test | |||
| 2010 | 54.0% | 57.0% | 55.0% |
| 2009 | 62.0% | 54.0% | 54.0% |
| 2008 | 54.0% | 49.0% | 49.0% |
| CST Mathematics Test | |||
| 2010 | 40.0% | 49.0% | 48.0% |
| 2009 | 42.0% | 44.0% | 43.0% |
| 2008 | 42.0% | 42.0% | 41.0% |
Grade 8 - % of students at or above proficiency
| School | District | State | |
|---|---|---|---|
| CST Algebra I Test | |||
| 2010 | 32.0% | 41.0% | 46.0% |
| 2009 | 27.0% | 38.0% | 44.0% |
| 2008 | 14.0% | 31.0% | 42.0% |
| CST English-Language Arts Test | |||
| 2010 | 64.0% | 58.0% | 54.0% |
| 2009 | 58.0% | 49.0% | 48.0% |
| 2008 | 51.0% | 48.0% | 45.0% |
| CST General Mathematics Test | |||
| 2010 | 13.0% | 23.0% | 30.0% |
| 2009 | 11.0% | 15.0% | 30.0% |
| CST History - Social Science Test | |||
| 2010 | 50.0% | 49.0% | 47.0% |
| 2009 | 38.0% | 40.0% | 42.0% |
| 2008 | 35.0% | 37.0% | 36.0% |
| CST Science Test | |||
| 2010 | 71.0% | 62.0% | 59.0% |
| 2009 | 43.0% | 51.0% | 56.0% |
| 2008 | 27.0% | 47.0% | 52.0% |
| CST Geometry Test | |||
| 2009 | 75.0% | 89.0% | 87.0% |
Grade 9 - % of students at or above proficiency
| School | District | State | |
|---|---|---|---|
| CST Algebra I Test | |||
| 2010 | 7.0% | 15.0% | 22.0% |
| 2009 | 11.0% | 13.0% | 21.0% |
| 2008 | 5.0% | 8.0% | 18.0% |
| CST Algebra II Test | |||
| 2010 | 29.0% | 59.0% | 69.0% |
| CST Earth Science Test | |||
| 2010 | 35.0% | 31.0% | 35.0% |
| 2009 | 18.0% | 23.0% | 29.0% |
| 2008 | 27.0% | 21.0% | 31.0% |
| CST English-Language Arts Test | |||
| 2010 | 80.0% | 58.0% | 54.0% |
| 2009 | 74.0% | 52.0% | 50.0% |
| 2008 | 65.0% | 50.0% | 49.0% |
| CST Geometry Test | |||
| 2010 | 18.0% | 29.0% | 46.0% |
| 2009 | 25.0% | 28.0% | 47.0% |
| 2008 | 15.0% | 26.0% | 43.0% |
| CST Physics Test | |||
| 2010 | 73.0% | 49.0% | 40.0% |
| 2009 | 29.0% | 36.0% | 35.0% |
| 2008 | 18.0% | 31.0% | 30.0% |
Grade 10 - % of students at or above proficiency
| School | District | State | |
|---|---|---|---|
| CST Algebra II Test | |||
| 2010 | 9.0% | 25.0% | 40.0% |
| 2009 | 6.0% | 22.0% | 37.0% |
| 2008 | 4.0% | 20.0% | 36.0% |
| CST Biology Test | |||
| 2010 | 45.0% | 37.0% | 38.0% |
| CST Chemistry Test | |||
| 2010 | 29.0% | 48.0% | 47.0% |
| 2009 | 17.0% | 36.0% | 44.0% |
| 2008 | 14.0% | 31.0% | 41.0% |
| CST English-Language Arts Test | |||
| 2010 | 69.0% | 48.0% | 45.0% |
| 2009 | 54.0% | 44.0% | 44.0% |
| 2008 | 48.0% | 40.0% | 41.0% |
| CST Science Test | |||
| 2010 | 54.0% | 44.0% | 46.0% |
| 2009 | 24.0% | 40.0% | 44.0% |
| 2008 | 14.0% | 32.0% | 40.0% |
| CST World History Test | |||
| 2010 | 39.0% | 39.0% | 42.0% |
| 2009 | 31.0% | 35.0% | 38.0% |
| 2008 | 24.0% | 29.0% | 33.0% |
| CST Geometry Test | |||
| 2009 | 3.0% | 7.0% | 14.0% |
Grade 11 - % of students at or above proficiency
| School | District | State | |
|---|---|---|---|
| CST Biology Test | |||
| 2010 | 56.0% | 58.0% | 46.0% |
| 2009 | 49.0% | 50.0% | 41.0% |
| 2008 | 48.0% | 43.0% | 39.0% |
| CST Chemistry Test | |||
| 2010 | 6.0% | 20.0% | 30.0% |
| CST English-Language Arts Test | |||
| 2010 | 57.0% | 45.0% | 42.0% |
| 2009 | 55.0% | 41.0% | 40.0% |
| 2008 | 53.0% | 38.0% | 37.0% |
| CST Summative High School Math Test | |||
| 2010 | 16.0% | 35.0% | 50.0% |
| 2009 | 14.0% | 32.0% | 47.0% |
| 2008 | 8.0% | 30.0% | 43.0% |
| CST U.S. History Test | |||
| 2010 | 40.0% | 47.0% | 45.0% |
| 2009 | 41.0% | 44.0% | 44.0% |
| 2008 | 41.0% | 36.0% | 38.0% |
End of Course - % of students at or above proficiency
| School | District | State | |
|---|---|---|---|
| CST Algebra I Test | |||
| 2010 | 29.0% | 34.0% | 31.0% |
| 2009 | 26.0% | 30.0% | 28.0% |
| 2008 | 13.0% | 25.0% | 25.0% |
| CST Algebra II Test | |||
| 2010 | 10.0% | 22.0% | 31.0% |
| 2009 | 7.0% | 19.0% | 28.0% |
| 2008 | 4.0% | 17.0% | 27.0% |
| CST Biology Test | |||
| 2010 | 51.0% | 44.0% | 46.0% |
| 2009 | 49.0% | 40.0% | 42.0% |
| 2008 | 48.0% | 38.0% | 42.0% |
| CST Chemistry Test | |||
| 2010 | 25.0% | 29.0% | 38.0% |
| 2009 | 18.0% | 23.0% | 36.0% |
| 2008 | 14.0% | 26.0% | 32.0% |
| CST Earth Science Test | |||
| 2010 | 35.0% | 31.0% | 33.0% |
| 2009 | 18.0% | 23.0% | 28.0% |
| 2008 | 26.0% | 21.0% | 28.0% |
| CST General Mathematics Test | |||
| 2010 | 13.0% | 22.0% | 27.0% |
| 2009 | 10.0% | 15.0% | 26.0% |
| CST Geometry Test | |||
| 2010 | 15.0% | 22.0% | 27.0% |
| 2009 | 21.0% | 21.0% | 26.0% |
| 2008 | 9.0% | 17.0% | 24.0% |
| CST Physics Test | |||
| 2010 | 72.0% | 44.0% | 49.0% |
| 2009 | 28.0% | 34.0% | 46.0% |
| 2008 | 19.0% | 31.0% | 43.0% |
| CST Summative High School Math Test | |||
| 2010 | 19.0% | 39.0% | 54.0% |
| 2009 | 17.0% | 37.0% | 50.0% |
| 2008 | 9.0% | 34.0% | 47.0% |
| CST World History Test | |||
| 2010 | 39.0% | 41.0% | 41.0% |
| 2009 | 30.0% | 38.0% | 38.0% |
| 2008 | 25.0% | 31.0% | 33.0% |
Source: CA Department of Education 2009-2010
School Map and Similar Schools Nearby
Click to Activate Map of Nearby School Campuses
Private
Public
This School
Similar Schools Nearby
| Bell Junior High School 6-8 | 1,075 Students | 0.9 miles away | Not Yet Rated | |
| Morse High School 9-12 | 2,339 Students | 1.6 miles away | Not Yet Rated | |
| Lincoln High School 9-12 | 2,161 Students | 3.1 miles away | Not Yet Rated | - |
| Invention and Design Educational Academy 9-12 | 331 Students | 5.3 miles away | Not Yet Rated | |
| Hoover High School 9-12 | 2,163 Students | 6.1 miles away | Not Yet Rated | |
| Montgomery High School 9-12 | 1,716 Students | 6.6 miles away | ![]() 1 out of 5 | |
| Scitech High School 9-12 | 554 Students | 6.7 miles away | Not Yet Rated | |
| Coronado High School 9-12 | 1,120 Students | 7.6 miles away | Not Yet Rated | |
| Southwest High School 9-12 | 1,739 Students | 8.0 miles away | ![]() 3 out of 5 | |
| San Ysidro High School 9-12 | 2,392 Students | 8.1 miles away | Not Yet Rated | |
Compare This School To Nearby Schools ->
School Community Forum

Join a discussion about San Diego School of Creative and Performing Art and talk to others in the community including students, parents, teachers, and administrators.
Popular Discussion Topics
- Admissions and Registration Questions (e.g. Dress Code and Discipline Policy)
- School Calendar and Upcoming Events (e.g. Graduation)
- After School Programs, Extracurricular Activities, and Athletics (e.g. Football)
- News and Announcements (e.g. Yearbook and Class Supply List Details)
- Graduate and Alumni Events (e.g. Organizing Class Reunions)
Navigation
Can't Find What You Are Looking For?
Rankings
Sponsored Links
K-12 Articles
Preparing Your Child for the First Day of School
It seems like school was just dismissed for the summer, yet here we are facing another year of back...
What to Do when Your Student is Held Back
Kids develop at different speeds, and everyone has different skills and abilities. School is easy...
Changing Schools Isn't Easy: Tips for a Successful Transition
It isn't easy for students to make the transition into a new school, especially if they have...


