O'farrell Community Charter School
Rating
Not Available
Not Available

No Reviews Yet
Find Old Friends From O'farrell Community Charter School
Use the form below to search for alumni from O'farrell Community Charter School.
School Description
School Summary and Highlights
- Enrolls 848 middle school students from grades 6-8
- Ranks 1289th out of 2,050 middle schools in CA.
- 2010 Overall School AYP Met Status: No
Additional Contact Information
- Mailing Address: 6130 Skyline Dr., San Diego, CA 92114
School Operational Details
- Title I EligibleAll students of this school are eligible for participation in authorized programs.
- Charter School
School District Details
- San Diego Unified School District
- Per-Pupil Spending: $10,305
- Graduation Rate: 63.0%
- Dropout Rate: 2.4%
- Students Per Teacher: 20.1
- Enrolled Students: 131,163
Faculty Details and Student Enrollment
Students and Faculty
- Total Students Enrolled: 848
- Total Full Time "Equivalent" Teachers: 39.0
- Average Student-To-Teacher Ratio: 21.7
Students Gender Breakdown
- Males: 413 (48.7%)
- Females: 435 (51.3%)
Free Lunch Student Eligibility Breakdown
- Eligible for Reduced Lunch: 120 (14.2%)
- Eligible for Free Lunch: 547 (64.5%)
- Eligible for Either Reduced or Free Lunch: 667 (78.7%)
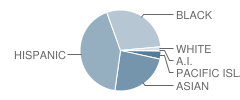
Student Enrollment Distribution by Race / Ethnicity
| Number | Percent | |
|---|---|---|
| American Indian | 3 | 0.4% |
| Black | 239 | 28.2% |
| Asian | 196 | 23.1% |
| Hispanic | 348 | 41.0% |
| White | 13 | 1.5% |
Number of Students Per Grade

| Number | Percent | |
|---|---|---|
| 6th Grade | 264 | 31.1% |
| 7th Grade | 305 | 36.0% |
| 8th Grade | 279 | 32.9% |
Teacher Education Background (2009)
Percent With Master's Degree
School:
34.0%
District:
80.1%
Percent With Bachelor's Degree
School:
64.0%
District:
16.8%
Teacher Credentials & Experience (2009)
Percent of Teachers With Credentials: 100.0%
Number of Certificated Staff: 50.0
Average Number of Years of Teacher Experience: 9.8
Average Age
School:
39.1
District:
46.6
Source: CA Department of Education, Source: NCES 2009-2010
School Ratings and Reviews
Be The First To Review O'farrell Community Charter School!
School Map and Similar Schools Nearby
Click to Activate Map of Nearby School Campuses
Private
Public
This School
Similar Schools Nearby
| Nubia Leadership Academy KG-6 | 299 Students | 0.2 miles away | Not Yet Rated | |
| Holly Drive Leadership Academy KG-8 | 147 Students | 1.3 miles away | Not Yet Rated | |
| Keiller Leadership Academy 6-8 | 464 Students | 1.5 miles away |  5 out of 5 | |
| Gompers Charter Middle School 6-8 | 556 Students | 1.8 miles away | Not Yet Rated | |
| Promise Charter School KG-8 | 193 Students | 2.1 miles away |  4.5 out of 5 | |
| Darnall E-Campus Charter School KG-6 | 536 Students | 3.1 miles away | Not Yet Rated | |
| King / Chavez Preparatory Academy 6-8 | 347 Students | 3.8 miles away |  2.5 out of 5 | |
| Iftin Charter School KG-8 | 229 Students | 3.9 miles away | Not Yet Rated | |
| Albert Einstein Academy Charter Middle 6-8 | 263 Students | 4.0 miles away | Not Yet Rated | |
| King / Chavez Charter School KG-8 | 302 Students | 4.0 miles away | Not Yet Rated | |
Compare This School To Nearby Schools ->
School Community Forum

Join a discussion about O'farrell Community Charter School and talk to others in the community including students, parents, teachers, and administrators.
Popular Discussion Topics
- Admissions and Registration Questions (e.g. Dress Code and Discipline Policy)
- School Calendar and Upcoming Events (e.g. Graduation)
- After School Programs, Extracurricular Activities, and Athletics (e.g. Football)
- News and Announcements (e.g. Yearbook and Class Supply List Details)
- Graduate and Alumni Events (e.g. Organizing Class Reunions)
Navigation
Can't Find What You Are Looking For?
Rankings
Nearby Cities
Sponsored Links
K-12 Articles

Helping Young Children with Printing and Cursive Writing
Is your child experiencing difficulty printing or writing? Is he unable to print or write legibly,...
Is your child experiencing difficulty printing or writing? Is he unable to print or write legibly,...

The First Day of School
The first day of kindergarten is a rite of passage for any student. Every mother cries and...
The first day of kindergarten is a rite of passage for any student. Every mother cries and...

Teaching Your Child Study Skills
Many children who have the capability to get good grades experience frustration because of low...
Many children who have the capability to get good grades experience frustration because of low...