San Jacinto Valley Academy
480 North San Jacinto Ave, San Jacinto, CA 92583 | (951) 654-6113
- Grades: KG-12
- Student Enrollment: 596
Rating
Not Available
Not Available

5 out of 5 | 1 Review
Find Old Friends From San Jacinto Valley Academy
Use the form below to search for alumni from San Jacinto Valley Academy.
School Description
School Summary and Highlights
- Enrolls 596 elementary, middle, and high school students from grades KG-12
- Ranks 1079th out of 1,197 high schools in CA.
- 2010 Overall School AYP Met Status: No
Additional Contact Information
- Mailing Address: 480 North San Jacinto Ave., San Jacinto, CA 92583
School Operational Details
- Charter School
School District Details
- San Jacinto Unified School District
- Per-Pupil Spending: $8,349
- Graduation Rate: 77.9%
- Dropout Rate: 3.9%
- Students Per Teacher: 24.4
- Enrolled Students: 9,627
Faculty Details and Student Enrollment
Students and Faculty
- Total Students Enrolled: 596
- Total Full Time "Equivalent" Teachers: 22.7
- Average Student-To-Teacher Ratio: 26.2
Students Gender Breakdown
- Males: 298 (50.0%)
- Females: 298 (50.0%)
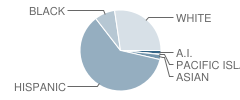
Student Enrollment Distribution by Race / Ethnicity
| Number | Percent | |
|---|---|---|
| American Indian | 9 | 1.5% |
| Black | 48 | 8.1% |
| Asian | 12 | 2.0% |
| Hispanic | 356 | 59.7% |
| White | 160 | 26.8% |
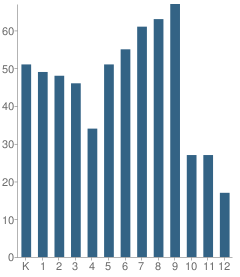
Number of Students Per Grade
| Number | Percent | |
|---|---|---|
| Kindergarten | 51 | 8.6% |
| 1st Grade | 49 | 8.2% |
| 2nd Grade | 48 | 8.1% |
| 3rd Grade | 46 | 7.7% |
| 4th Grade | 34 | 5.7% |
| 5th Grade | 51 | 8.6% |
| 6th Grade | 55 | 9.2% |
| 7th Grade | 61 | 10.2% |
| 8th Grade | 63 | 10.6% |
| 9th Grade | 67 | 11.2% |
| 10th Grade | 27 | 4.5% |
| 11th Grade | 27 | 4.5% |
| 12th Grade | 17 | 2.9% |
Teacher Education Background (2009)
Percent With Master's Degree
School:
20.0%
District:
25.0%
Percent With Bachelor's Degree
School:
12.0%
District:
7.1%
Teacher Credentials & Experience (2009)
Percent of Teachers With Credentials: 95.2%
Number of Certificated Staff: 25.0
Average Number of Years of Teacher Experience: 5.5
Average Age
School:
39.2
District:
42.0
Source: CA Department of Education, Source: NCES 2009-2010
School Ratings and Reviews
Overall Rating: 5

5 out of 5 | 1 Review
The Overall Rating is the school's average rating from parents, students, school faculty and staff. The highest rating is five apples and the lowest is one apple.
Share Your Review About This School
1 review for San Jacinto Valley Academy
- Reviewed by Parent/Guardian on May 28, 2010
- Rating:
 (5 / 5) Flag as inappropriate
 - Poor location, no parking, inadequate planning for pick up and drop off of students, locked gate policy, teachers and staff are hostile towards parents and send out mass notices followed by more confusing correction notices which are never circulated to teachers and staff which further compounds the uneasy relations between parents and staff.
School Map and Similar Schools Nearby
Click to Activate Map of Nearby School Campuses
Private
Public
This School
Similar Schools Nearby
| Hemet Academy for Applied Academics and Technology 9-12 | 213 Students | 3.0 miles away |  5 out of 5 | - |
| Nuview Bridge Academy 9-12 | 351 Students | 10.0 miles away | Not Yet Rated | |
| Santa Rosa Academy KG-12 | 573 Students | 14.3 miles away | Not Yet Rated | |
| Temecula Preparatory School KG-12 | 696 Students | 14.7 miles away |  1 out of 5 | |
| Choice 2000 On-Line School 7-12 | 234 Students | 15.3 miles away | Not Yet Rated | |
| California Military Institute School 7-12 | 542 Students | 15.7 miles away | Not Yet Rated | |
| Moreno Valley Community Learning Center School 7-12 | 101 Students | 17.5 miles away | Not Yet Rated | |
| Mercury On-Line Academy of Southern California KG-10 | 77 Students | 22.7 miles away | Not Yet Rated | - |
| Grove School 7-12 | 186 Students | 23.2 miles away | Not Yet Rated | |
Compare This School To Nearby Schools ->
School Community Forum

Join a discussion about San Jacinto Valley Academy and talk to others in the community including students, parents, teachers, and administrators.
Popular Discussion Topics
- Admissions and Registration Questions (e.g. Dress Code and Discipline Policy)
- School Calendar and Upcoming Events (e.g. Graduation)
- After School Programs, Extracurricular Activities, and Athletics (e.g. Football)
- News and Announcements (e.g. Yearbook and Class Supply List Details)
- Graduate and Alumni Events (e.g. Organizing Class Reunions)
Navigation
Can't Find What You Are Looking For?
Rankings
Nearby Cities
Sponsored Links
K-12 Articles

Tips for Purchasing Back to School Supplies
In just a few days, kids from all over the US will be going back to school. Now is the time to take...
In just a few days, kids from all over the US will be going back to school. Now is the time to take...

Making Sense of No Child Left Behind
The No Child Left Behind Act of 2001 has met with mixed results and mixed feelings. Some think it...
The No Child Left Behind Act of 2001 has met with mixed results and mixed feelings. Some think it...

The Impact on Adopted Children at School
Children who are adopted can be affected both academically and socially at school. Many times...
Children who are adopted can be affected both academically and socially at school. Many times...