Broadway High School
Rating
Not Available
Not Available

No Reviews Yet
Find Old Friends From Broadway High School
Use the form below to search for alumni from Broadway High School.
School Description
School Summary and Highlights
- Enrolls 240 high school students from grades 9-12
- 2010 Overall School AYP Met Status: Yes
Additional Contact Information
- Mailing Address: 22540 Parrotts Ferry Rd., Columbia, CA 95310
School Operational Details
- Alternative School
School District Details
- San Jose Unified School District
- Per-Pupil Spending: $10,005
- Graduation Rate: 76.5%
- Dropout Rate: 2.4%
- Students Per Teacher: 21.3
- Enrolled Students: 32,333
Faculty Details and Student Enrollment
Students and Faculty
- Total Students Enrolled: 240
- Total Full Time "Equivalent" Teachers: 15.0
- Average Student-To-Teacher Ratio: 16.0
Students Gender Breakdown
- Males: 116 (48.3%)
- Females: 124 (51.7%)
Free Lunch Student Eligibility Breakdown
- Eligible for Reduced Lunch: 21 (8.8%)
- Eligible for Free Lunch: 129 (53.8%)
- Eligible for Either Reduced or Free Lunch: 150 (62.5%)
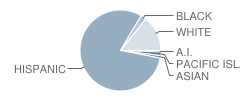
Student Enrollment Distribution by Race / Ethnicity
| Number | Percent | |
|---|---|---|
| American Indian | 2 | 0.8% |
| Black | 6 | 2.5% |
| Asian | 3 | 1.3% |
| Hispanic | 190 | 79.2% |
| White | 34 | 14.2% |
Number of Students Per Grade

| Number | Percent | |
|---|---|---|
| 9th Grade | 2 | 0.8% |
| 10th Grade | 24 | 10.0% |
| 11th Grade | 70 | 29.2% |
| 12th Grade | 144 | 60.0% |
Graduates Information (2010)
Graduation Rate
School:
86.2%
District:
86.2%
State:
78.6%
Teacher Education Background (2009)
Percent With Master's Degree
School:
56.3%
District:
54.0%
Percent With Bachelor's Degree
School:
12.5%
District:
19.9%
Teacher Credentials & Experience (2009)
Percent of Teachers With Emergency Credentials: 21.4%
Percent of Teachers With Credentials: 100.0%
Number of Certificated Staff: 16.0
Average Number of Years of Teacher Experience: 10.9
Average Age
School:
48.0
District:
49.0
Source: CA Department of Education, Source: NCES 2009-2010
School Ratings and Reviews
Be The First To Review Broadway High School!
School Map and Similar Schools Nearby
Click to Activate Map of Nearby School Campuses
Private
Public
This School
Similar Schools Nearby
| Pioneer Plus (Continuation) School 9-12 | 40 Students | 0.9 miles away | Not Yet Rated | |
| Gunderson Plus (Continuation) School 9-12 | 40 Students | 1.6 miles away | Not Yet Rated | |
| Liberty High (Alternative) School 6-12 | 395 Students | 1.7 miles away | Not Yet Rated | |
| Willow Glen Plus (Continuation) School 9-12 | 40 Students | 2.3 miles away | Not Yet Rated | |
| Camden Community Day School 9-12 | 38 Students | 3.2 miles away |  5 out of 5 | |
| Alternative Placement Academy 9-12 | 10 Students | 3.3 miles away | Not Yet Rated | |
| Phoenix High School 9-12 | 81 Students | 3.3 miles away | Not Yet Rated | |
| Leland Plus (Continuation) School 9-12 | 40 Students | 3.4 miles away | Not Yet Rated | |
| Apollo High School 10-12 | 144 Students | 5.0 miles away | Not Yet Rated | |
| Lincoln Plus High School 10-12 | 40 Students | 5.1 miles away | Not Yet Rated | |
Compare This School To Nearby Schools ->
School Community Forum

Join a discussion about Broadway High School and talk to others in the community including students, parents, teachers, and administrators.
Popular Discussion Topics
- Admissions and Registration Questions (e.g. Dress Code and Discipline Policy)
- School Calendar and Upcoming Events (e.g. Graduation)
- After School Programs, Extracurricular Activities, and Athletics (e.g. Football)
- News and Announcements (e.g. Yearbook and Class Supply List Details)
- Graduate and Alumni Events (e.g. Organizing Class Reunions)
Navigation
Can't Find What You Are Looking For?
Rankings
Nearby Cities
Sponsored Links
K-12 Articles

Middle School Homework and Study Habits
The report cards came home and you're disappointed with your child's scores. You know he has the...
The report cards came home and you're disappointed with your child's scores. You know he has the...

Your Child and School Corporal Punishment
Your child comes home at the end of the school day with a huge bruise on his upper arm. When you...
Your child comes home at the end of the school day with a huge bruise on his upper arm. When you...

The Importance of Reading for Children Preschool to Grade Three
The first teachers of children are their parents. From the time they are infants, children need to...
The first teachers of children are their parents. From the time they are infants, children need to...