Gunderson High School
Rating
Not Available
Not Available

4 out of 5 | 1 Review
Find Old Friends From Gunderson High School
Use the form below to search for alumni from Gunderson High School.
School Description
School Summary and Highlights
- Enrolls 1,073 high school students from grades 9-12
- Ranks 581st out of 1,197 high schools in CA.
- 2010 Overall School AYP Met Status: No
Additional Contact Information
- Mailing Address: 622 Gaundabert Ln., San Jose, CA 95136
School District Details
- San Jose Unified School District
- Per-Pupil Spending: $10,005
- Graduation Rate: 76.5%
- Dropout Rate: 2.4%
- Students Per Teacher: 21.3
- Enrolled Students: 32,333
Faculty Details and Student Enrollment
Students and Faculty
- Total Students Enrolled: 1,073
- Total Full Time "Equivalent" Teachers: 55.3
- Average Student-To-Teacher Ratio: 19.4
Students Gender Breakdown
- Males: 588 (54.8%)
- Females: 485 (45.2%)
Free Lunch Student Eligibility Breakdown
- Eligible for Reduced Lunch: 113 (10.5%)
- Eligible for Free Lunch: 455 (42.4%)
- Eligible for Either Reduced or Free Lunch: 568 (52.9%)
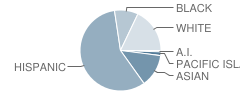
Student Enrollment Distribution by Race / Ethnicity
| Number | Percent | |
|---|---|---|
| American Indian | 8 | 0.7% |
| Black | 101 | 9.4% |
| Asian | 139 | 13.0% |
| Hispanic | 601 | 56.0% |
| White | 189 | 17.6% |
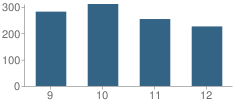
Number of Students Per Grade
| Number | Percent | |
|---|---|---|
| 9th Grade | 282 | 26.3% |
| 10th Grade | 311 | 29.0% |
| 11th Grade | 254 | 23.7% |
| 12th Grade | 226 | 21.1% |
Graduates Information (2010)
Graduation Rate
School:
92.7%
District:
86.2%
State:
78.6%
Teacher Education Background (2009)
Percent With Ph.D.
School:
1.6%
District:
2.5%
Percent With Master's Degree
School:
32.8%
District:
54.0%
Percent With Bachelor's Degree
School:
27.9%
District:
19.9%
Teacher Credentials & Experience (2009)
Percent of Teachers With Emergency Credentials: 7.1%
Percent of Teachers With Credentials: 91.1%
Number of Certificated Staff: 61.0
Average Number of Years of Teacher Experience: 12.2
Average Age
School:
43.1
District:
49.0
Source: CA Department of Education, Source: NCES 2009-2010
School Ratings and Reviews
Overall Rating: 4

4 out of 5 | 1 Review
The Overall Rating is the school's average rating from parents, students, school faculty and staff. The highest rating is five apples and the lowest is one apple.
Share Your Review About This School
1 review for Gunderson High School
- Reviewed by Student on December 29, 2008
- Rating:
 (4 / 5) Flag as inappropriate
 - the school really isn't that bad. the laptops are wonderful to have and the students there are very lucky. and although students don't really start to really use the laptops until junior year, maybe even sophomore year (depending on the student's schedule of course) then even the one or two years the student has the latptop is useful for them to get used to using it if they're not and getting used to knowing how to do things on the applications or computer itself. also, its easy to do essays and papers or projects on them at home or anywhere really. the teachers there are notable for loving ones and they are there because they want to be there, they have a reason in their life for teaching. some are really teaching because they just want to teach others, they really want others to learn and could care less if they even remembered them. of course there's a couple "bad" teachers but thats unavoidable at any school. the student body there is very diverse and there's no cliques like at many other schools like pioneer or willow glen. i was surprised a freshmen knew so many people of every grade bfore the end of the first semester. its a great environment really. and any rumors like someone got shot or there's fights everyday are of course exaggerated. maybe so there are fights but what schoool hasn't had fights there. and if there was someone shot, there's probably been someone shot at many other schools too and even then truth is, someone got shot but many many years ago and by now, its a tale thats been greatly exaggerated.
School Map and Similar Schools Nearby
Click to Activate Map of Nearby School Campuses
Private
Public
This School
Similar Schools Nearby
| Pioneer High School 9-12 | 1,595 Students | 1.9 miles away | Not Yet Rated | |
| Oak Grove High School 9-12 | 2,395 Students | 1.9 miles away |  1 out of 5 | |
| Santa Teresa High School 9-12 | 2,426 Students | 2.0 miles away |  3.5 out of 5 | |
| Sylvandale Junior High School 7-8 | 874 Students | 2.5 miles away | Not Yet Rated | |
| Branham High School 9-12 | 1,386 Students | 2.6 miles away | Not Yet Rated | |
| Leland High School 9-12 | 1,845 Students | 2.6 miles away | Not Yet Rated | |
| Andrew P. Hill High School 9-12 | 2,373 Students | 2.7 miles away | Not Yet Rated | |
| Willow Glen High School 9-12 | 1,456 Students | 3.3 miles away | Not Yet Rated | |
| Leigh High School 9-12 | 1,713 Students | 4.0 miles away |  5 out of 5 | |
| Silver Creek High School 9-12 | 2,528 Students | 4.0 miles away | Not Yet Rated | |
Compare This School To Nearby Schools ->
School Community Forum

Join a discussion about Gunderson High School and talk to others in the community including students, parents, teachers, and administrators.
Popular Discussion Topics
- Admissions and Registration Questions (e.g. Dress Code and Discipline Policy)
- School Calendar and Upcoming Events (e.g. Graduation)
- After School Programs, Extracurricular Activities, and Athletics (e.g. Football)
- News and Announcements (e.g. Yearbook and Class Supply List Details)
- Graduate and Alumni Events (e.g. Organizing Class Reunions)
Navigation
Can't Find What You Are Looking For?
Rankings
Nearby Cities
Sponsored Links
K-12 Articles

The Most Used Form of Communication
Writing has, quite surprisingly, become more and more important in today's electronic society....
Writing has, quite surprisingly, become more and more important in today's electronic society....

Parent and Family Involvement in School
When visiting my grandson's school, I often hear administrators and teachers complaining that not...
When visiting my grandson's school, I often hear administrators and teachers complaining that not...

Keeping Our Kids Safe in the Post 9/11 World
Recently, radio talk show host and CNN personality did a week-long special entitled "The Perfect...
Recently, radio talk show host and CNN personality did a week-long special entitled "The Perfect...