Peter Burnett Middle School
Rating
Not Available
Not Available

No Reviews Yet
Find Old Friends From Peter Burnett Middle School
Use the form below to search for alumni from Peter Burnett Middle School.
School Description
School Summary and Highlights
- Enrolls 865 middle school students from grades 6-8
- Ranks 1944th out of 2,050 middle schools in CA.
- 2010 Overall School AYP Met Status: No
Additional Contact Information
- Mailing Address: 850 North Second St., San Jose, CA 95112
School District Details
- San Jose Unified School District
- Per-Pupil Spending: $10,005
- Graduation Rate: 76.5%
- Dropout Rate: 2.4%
- Students Per Teacher: 21.3
- Enrolled Students: 32,333
Faculty Details and Student Enrollment
Students and Faculty
- Total Students Enrolled: 865
- Total Full Time "Equivalent" Teachers: 45.1
- Average Student-To-Teacher Ratio: 19.2
Students Gender Breakdown
- Males: 453 (52.4%)
- Females: 412 (47.6%)
Free Lunch Student Eligibility Breakdown
- Eligible for Reduced Lunch: 93 (10.8%)
- Eligible for Free Lunch: 597 (69.0%)
- Eligible for Either Reduced or Free Lunch: 690 (79.8%)
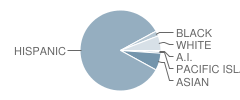
Student Enrollment Distribution by Race / Ethnicity
| Number | Percent | |
|---|---|---|
| American Indian | 5 | 0.6% |
| Black | 19 | 2.2% |
| Asian | 60 | 6.9% |
| Hispanic | 713 | 82.4% |
| White | 51 | 5.9% |
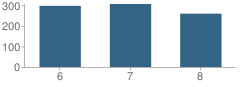
Number of Students Per Grade
| Number | Percent | |
|---|---|---|
| 6th Grade | 298 | 34.5% |
| 7th Grade | 307 | 35.5% |
| 8th Grade | 260 | 30.1% |
Teacher Education Background (2009)
Percent With Master's Degree
School:
22.4%
District:
54.0%
Percent With Bachelor's Degree
School:
32.7%
District:
19.9%
Teacher Credentials & Experience (2009)
Percent of Teachers With Emergency Credentials: 8.9%
Percent of Teachers With Credentials: 86.7%
Number of Certificated Staff: 49.0
Average Number of Years of Teacher Experience: 11.0
Average Age
School:
38.0
District:
49.0
Source: CA Department of Education, Source: NCES 2009-2010
School Ratings and Reviews
Be The First To Review Peter Burnett Middle School!
School Map and Similar Schools Nearby
Click to Activate Map of Nearby School Campuses
Private
Public
This School
Similar Schools Nearby
| Herbert Hoover Middle School 6-8 | 1,033 Students | 1.8 miles away |  5 out of 5 | |
| Buchser Middle School 6-8 | 960 Students | 2.4 miles away | 5 out of 5 | |
| Luther Burbank Elementary School KG-8 | 569 Students | 2.5 miles away | Not Yet Rated | |
| Mckinley Elementary School KG-6 | 532 Students | 2.5 miles away | Not Yet Rated | |
| Orchard Elementary School KG-8 | 836 Students | 2.6 miles away | 5 out of 5 | |
| River Glen School KG-8 | 538 Students | 2.9 miles away | Not Yet Rated | |
| Lee Mathson Middle School 6-8 | 595 Students | 3.2 miles away | 5 out of 5 | |
| Robert F. Kennedy Elementary School KG-6 | 709 Students | 3.3 miles away | Not Yet Rated | |
| Success Academy KG-6 | 245 Students | 3.4 miles away | Not Yet Rated | |
| Santee Elementary School KG-6 | 475 Students | 3.5 miles away | Not Yet Rated | |
Compare This School To Nearby Schools ->
School Community Forum

Join a discussion about Peter Burnett Middle School and talk to others in the community including students, parents, teachers, and administrators.
Popular Discussion Topics
- Admissions and Registration Questions (e.g. Dress Code and Discipline Policy)
- School Calendar and Upcoming Events (e.g. Graduation)
- After School Programs, Extracurricular Activities, and Athletics (e.g. Football)
- News and Announcements (e.g. Yearbook and Class Supply List Details)
- Graduate and Alumni Events (e.g. Organizing Class Reunions)
Navigation
Can't Find What You Are Looking For?
Rankings
Nearby Cities
Sponsored Links
K-12 Articles

Asperger Syndrome: A Developmental Disorder on the Autism Spectrum
Asperger Syndrome, also known as Pervasive Developmental Disorder is on the high functioning end of...
Asperger Syndrome, also known as Pervasive Developmental Disorder is on the high functioning end of...

Bullycide: What is It and How Can It Be Prevented?
Disclaimer: This article expresses my opinion that has been formed by personal experience and...
Disclaimer: This article expresses my opinion that has been formed by personal experience and...

Teaching Your Kids About Respect, Values and Violence
These days it seems that every newscast reports at least once incident of violence. As parents, we...
These days it seems that every newscast reports at least once incident of violence. As parents, we...