Visions in Education School

No Reviews Yet
Find Old Friends From Visions in Education School
Use the form below to search for alumni from Visions in Education School.
School Description
School Summary and Highlights
- Enrolls 3,362 elementary, middle, and high school students from grades KG-12
- Ranks 1023rd out of 1,197 high schools in CA.
- 2010 Overall School AYP Met Status: No
Additional Contact Information
- Mailing Address: 4800 Manzanita Ave., Ste. 1, Carmichael, CA 95608
School Operational Details
- Title I EligibleAll students of this school are eligible for participation in authorized programs.
- Charter School
School District Details
- San Juan Unified School District
- Per-Pupil Spending: $9,141
- Graduation Rate: 86.5%
- Dropout Rate: 6.6%
- Students Per Teacher: 21.7
- Enrolled Students: 47,045
Faculty Details and Student Enrollment
Students and Faculty
- Total Students Enrolled: 3,362
- Total Full Time "Equivalent" Teachers: 123.0
- Average Student-To-Teacher Ratio: 27.3
Students Gender Breakdown
- Males: 1,551 (46.1%)
- Females: 1,811 (53.9%)
Free Lunch Student Eligibility Breakdown
- Eligible for Reduced Lunch: 38 (1.1%)
- Eligible for Free Lunch: 463 (13.8%)
- Eligible for Either Reduced or Free Lunch: 501 (14.9%)
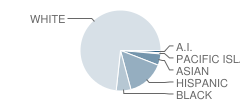
Student Enrollment Distribution by Race / Ethnicity

| Number | Percent | |
|---|---|---|
| American Indian | 37 | 1.1% |
| Black | 201 | 6.0% |
| Asian | 157 | 4.7% |
| Hispanic | 501 | 14.9% |
| White | 2,436 | 72.5% |
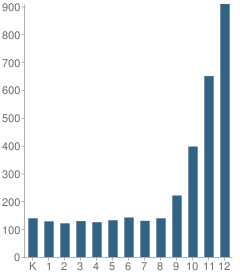
Number of Students Per Grade

| Number | Percent | |
|---|---|---|
| Kindergarten | 139 | 4.1% |
| 1st Grade | 128 | 3.8% |
| 2nd Grade | 121 | 3.6% |
| 3rd Grade | 129 | 3.8% |
| 4th Grade | 125 | 3.7% |
| 5th Grade | 132 | 3.9% |
| 6th Grade | 142 | 4.2% |
| 7th Grade | 130 | 3.9% |
| 8th Grade | 139 | 4.1% |
| 9th Grade | 221 | 6.6% |
| 10th Grade | 397 | 11.8% |
| 11th Grade | 650 | 19.3% |
| 12th Grade | 909 | 27.0% |
Graduates Information (2010)
Graduation Rate
School:
77.4%
District:
83.0%
State:
78.6%
Teacher Education Background (2009)
Percent With Master's Degree
School:
25.0%
District:
70.4%
Percent With Bachelor's Degree
School:
64.1%
District:
1.9%
Teacher Credentials & Experience (2009)
Percent of Teachers With Credentials: 100.0%
Number of Certificated Staff: 156.0
Average Number of Years of Teacher Experience: 8.6
Average Age
School:
42.4
District:
50.5
Source: CA Department of Education, Source: NCES 2009-2010
School Ratings and Reviews
Be The First To Review Visions in Education School!
Sponsored Links
Test Scores and Performance Information
Overall School Rating
How is this determined?
The overall school rating shows that Visions in Education School performed on average worse than many other schools across the state on CST state exams in the following subjects:
- CST Algebra I
- CST Algebra II
- CST Biology
- CST Chemistry
- CST Earth Science
- CST English-Language Arts
- CST General Mathematics
- CST Geometry
- CST History - Social Science
- CST Mathematics
- CST Science
- CST Summative High School Math
- CST U.S. History
- CST World History
AYP Results (2010)
Overall AYP Met: No
ELA AYP Met: No
Math AYP Met: No
ACT Exam Results (2009)
Percent of Students Taking ACT Exam: 0.7%
SAT Exam Results (2009)
Percent of Students Taking SAT Exam: 2.4%
Average Combined Score: 1,556.8
Critical Reading Average: 539.1
Math Average: 482.3
Writing Average: 535.5
Percent Scoring At or Above 1500: 72.7%
CST - Test Proficiency by Grade and Subject
Grade 2 - % of students at or above proficiency
| School | District | State | |
|---|---|---|---|
| CST English-Language Arts Test | |||
| 2010 | 44.0% | 53.0% | 53.0% |
| 2009 | 46.0% | 55.0% | 53.0% |
| 2008 | 40.0% | 50.0% | 48.0% |
| CST Mathematics Test | |||
| 2010 | 55.0% | 64.0% | 62.0% |
| 2009 | 45.0% | 65.0% | 63.0% |
| 2008 | 41.0% | 64.0% | 59.0% |
Grade 3 - % of students at or above proficiency
| School | District | State | |
|---|---|---|---|
| CST English-Language Arts Test | |||
| 2010 | 43.0% | 46.0% | 43.0% |
| 2009 | 41.0% | 50.0% | 44.0% |
| 2008 | 36.0% | 45.0% | 38.0% |
| CST Mathematics Test | |||
| 2010 | 45.0% | 66.0% | 65.0% |
| 2009 | 44.0% | 67.0% | 64.0% |
| 2008 | 36.0% | 66.0% | 61.0% |
Grade 4 - % of students at or above proficiency
| School | District | State | |
|---|---|---|---|
| CST English-Language Arts Test | |||
| 2010 | 66.0% | 66.0% | 63.0% |
| 2009 | 74.0% | 69.0% | 61.0% |
| 2008 | 57.0% | 60.0% | 55.0% |
| CST Mathematics Test | |||
| 2010 | 46.0% | 66.0% | 68.0% |
| 2009 | 53.0% | 68.0% | 66.0% |
| 2008 | 37.0% | 63.0% | 61.0% |
Grade 5 - % of students at or above proficiency
| School | District | State | |
|---|---|---|---|
| CST English-Language Arts Test | |||
| 2010 | 75.0% | 65.0% | 58.0% |
| 2009 | 69.0% | 60.0% | 54.0% |
| 2008 | 62.0% | 56.0% | 48.0% |
| CST Mathematics Test | |||
| 2010 | 46.0% | 62.0% | 61.0% |
| 2009 | 36.0% | 57.0% | 57.0% |
| 2008 | 43.0% | 57.0% | 51.0% |
| CST Science Test | |||
| 2010 | 67.0% | 67.0% | 56.0% |
| 2009 | 58.0% | 61.0% | 49.0% |
| 2008 | 63.0% | 57.0% | 46.0% |
Grade 6 - % of students at or above proficiency
| School | District | State | |
|---|---|---|---|
| CST English-Language Arts Test | |||
| 2010 | 63.0% | 63.0% | 55.0% |
| 2009 | 70.0% | 62.0% | 52.0% |
| 2008 | 65.0% | 56.0% | 47.0% |
| CST Mathematics Test | |||
| 2010 | 40.0% | 57.0% | 52.0% |
| 2009 | 45.0% | 58.0% | 49.0% |
| 2008 | 42.0% | 53.0% | 44.0% |
Grade 7 - % of students at or above proficiency
| School | District | State | |
|---|---|---|---|
| CST Algebra I Test | |||
| 2010 | 69.0% | 88.0% | 84.0% |
| CST English-Language Arts Test | |||
| 2010 | 77.0% | 63.0% | 55.0% |
| 2009 | 78.0% | 62.0% | 54.0% |
| 2008 | 62.0% | 56.0% | 49.0% |
| CST Mathematics Test | |||
| 2010 | 46.0% | 54.0% | 48.0% |
| 2009 | 43.0% | 48.0% | 43.0% |
| 2008 | 45.0% | 47.0% | 41.0% |
Grade 8 - % of students at or above proficiency
| School | District | State | |
|---|---|---|---|
| CST Algebra I Test | |||
| 2010 | 25.0% | 47.0% | 46.0% |
| 2009 | 17.0% | 47.0% | 44.0% |
| 2008 | 24.0% | 44.0% | 42.0% |
| CST English-Language Arts Test | |||
| 2010 | 68.0% | 59.0% | 54.0% |
| 2009 | 60.0% | 54.0% | 48.0% |
| 2008 | 67.0% | 52.0% | 45.0% |
| CST General Mathematics Test | |||
| 2010 | 31.0% | 31.0% | 30.0% |
| 2009 | 28.0% | 29.0% | 30.0% |
| 2008 | 40.0% | 28.0% | 31.0% |
| CST History - Social Science Test | |||
| 2010 | 52.0% | 51.0% | 47.0% |
| 2009 | 45.0% | 46.0% | 42.0% |
| 2008 | 43.0% | 43.0% | 36.0% |
| CST Science Test | |||
| 2010 | 57.0% | 67.0% | 59.0% |
| 2009 | 51.0% | 65.0% | 56.0% |
| 2008 | 45.0% | 59.0% | 52.0% |
Grade 9 - % of students at or above proficiency
| School | District | State | |
|---|---|---|---|
| CST Algebra I Test | |||
| 2010 | 10.0% | 27.0% | 22.0% |
| 2009 | 9.0% | 23.0% | 21.0% |
| 2008 | 7.0% | 26.0% | 18.0% |
| CST Biology Test | |||
| 2010 | 33.0% | 66.0% | 55.0% |
| 2009 | 39.0% | 65.0% | 51.0% |
| 2008 | 47.0% | 74.0% | 52.0% |
| CST Earth Science Test | |||
| 2010 | 27.0% | 28.0% | 35.0% |
| 2009 | 24.0% | 25.0% | 29.0% |
| 2008 | 29.0% | 32.0% | 31.0% |
| CST English-Language Arts Test | |||
| 2010 | 47.0% | 60.0% | 54.0% |
| 2009 | 45.0% | 55.0% | 50.0% |
| 2008 | 37.0% | 56.0% | 49.0% |
| CST General Mathematics Test | |||
| 2010 | 16.0% | 18.0% | 17.0% |
| 2009 | 17.0% | 21.0% | 17.0% |
| 2008 | 16.0% | 25.0% | 18.0% |
| CST Geometry Test | |||
| 2010 | 16.0% | 44.0% | 46.0% |
| 2009 | 8.0% | 50.0% | 47.0% |
| 2008 | 3.0% | 45.0% | 43.0% |
| CST World History Test | |||
| 2010 | 27.0% | 51.0% | 45.0% |
| 2009 | 20.0% | 52.0% | 41.0% |
| 2008 | 22.0% | 44.0% | 36.0% |
Grade 10 - % of students at or above proficiency
| School | District | State | |
|---|---|---|---|
| CST Algebra I Test | |||
| 2010 | 5.0% | 17.0% | 12.0% |
| 2009 | 3.0% | 14.0% | 11.0% |
| CST Algebra II Test | |||
| 2010 | 3.0% | 33.0% | 40.0% |
| 2009 | - | - | - |
| 2008 | 6.0% | 32.0% | 36.0% |
| CST Biology Test | |||
| 2010 | 16.0% | 32.0% | 38.0% |
| 2009 | 18.0% | 38.0% | 34.0% |
| 2008 | 11.0% | 40.0% | 35.0% |
| CST Chemistry Test | |||
| 2010 | 9.0% | 47.0% | 47.0% |
| CST Earth Science Test | |||
| 2010 | 37.0% | 26.0% | 29.0% |
| 2009 | 22.0% | 27.0% | 23.0% |
| 2008 | 24.0% | 23.0% | 23.0% |
| CST English-Language Arts Test | |||
| 2010 | 29.0% | 45.0% | 45.0% |
| 2009 | 28.0% | 45.0% | 44.0% |
| 2008 | 27.0% | 45.0% | 41.0% |
| CST Geometry Test | |||
| 2010 | 3.0% | 17.0% | 14.0% |
| 2009 | 4.0% | 18.0% | 14.0% |
| CST Science Test | |||
| 2010 | 22.0% | 47.0% | 46.0% |
| 2009 | 23.0% | 48.0% | 44.0% |
| 2008 | 16.0% | 45.0% | 40.0% |
| CST World History Test | |||
| 2010 | 19.0% | 45.0% | 42.0% |
| 2009 | 19.0% | 41.0% | 38.0% |
| 2008 | 10.0% | 35.0% | 33.0% |
Grade 11 - % of students at or above proficiency
| School | District | State | |
|---|---|---|---|
| CST Algebra I Test | |||
| 2010 | 1.0% | 7.0% | 8.0% |
| 2009 | 1.0% | 8.0% | 8.0% |
| CST Algebra II Test | |||
| 2010 | 3.0% | 18.0% | 14.0% |
| CST Biology Test | |||
| 2010 | 10.0% | 41.0% | 46.0% |
| 2009 | 9.0% | 45.0% | 41.0% |
| 2008 | 6.0% | 41.0% | 39.0% |
| CST Chemistry Test | |||
| 2010 | 33.0% | 33.0% | 30.0% |
| 2009 | - | - | - |
| 2008 | 21.0% | 28.0% | 25.0% |
| CST Earth Science Test | |||
| 2010 | 24.0% | 33.0% | 32.0% |
| 2009 | 16.0% | 28.0% | 26.0% |
| 2008 | 19.0% | 31.0% | 28.0% |
| CST English-Language Arts Test | |||
| 2010 | 28.0% | 43.0% | 42.0% |
| 2009 | 21.0% | 42.0% | 40.0% |
| 2008 | 19.0% | 41.0% | 37.0% |
| CST Geometry Test | |||
| 2010 | 4.0% | 9.0% | 6.0% |
| 2009 | 1.0% | 9.0% | 7.0% |
| 2008 | 2.0% | 12.0% | 6.0% |
| CST Summative High School Math Test | |||
| 2010 | 7.0% | 51.0% | 50.0% |
| 2009 | 16.0% | 49.0% | 47.0% |
| CST U.S. History Test | |||
| 2010 | 22.0% | 48.0% | 45.0% |
| 2009 | 16.0% | 48.0% | 44.0% |
| 2008 | 8.0% | 41.0% | 38.0% |
| CST World History Test | |||
| 2010 | 13.0% | 17.0% | 15.0% |
| 2009 | 19.0% | 19.0% | 11.0% |
| 2008 | 13.0% | 16.0% | 9.0% |
End of Course - % of students at or above proficiency
| School | District | State | |
|---|---|---|---|
| CST Algebra I Test | |||
| 2010 | 9.0% | 36.0% | 31.0% |
| 2009 | 6.0% | 33.0% | 28.0% |
| 2008 | 3.0% | 31.0% | 25.0% |
| CST Algebra II Test | |||
| 2010 | 5.0% | 35.0% | 31.0% |
| 2009 | 12.0% | 35.0% | 28.0% |
| 2008 | 3.0% | 33.0% | 27.0% |
| CST Biology Test | |||
| 2010 | 16.0% | 45.0% | 46.0% |
| 2009 | 17.0% | 46.0% | 42.0% |
| 2008 | 11.0% | 47.0% | 42.0% |
| CST Chemistry Test | |||
| 2010 | 24.0% | 43.0% | 38.0% |
| 2009 | 20.0% | 44.0% | 36.0% |
| 2008 | 24.0% | 38.0% | 32.0% |
| CST Earth Science Test | |||
| 2010 | 27.0% | 29.0% | 33.0% |
| 2009 | 21.0% | 26.0% | 28.0% |
| 2008 | 25.0% | 31.0% | 28.0% |
| CST General Mathematics Test | |||
| 2010 | 22.0% | 26.0% | 27.0% |
| 2009 | 21.0% | 25.0% | 26.0% |
| 2008 | 24.0% | 27.0% | 27.0% |
| CST Geometry Test | |||
| 2010 | 6.0% | 34.0% | 27.0% |
| 2009 | 3.0% | 36.0% | 26.0% |
| 2008 | 1.0% | 34.0% | 24.0% |
| CST Summative High School Math Test | |||
| 2010 | 15.0% | 56.0% | 54.0% |
| 2009 | 26.0% | 55.0% | 50.0% |
| CST World History Test | |||
| 2010 | 20.0% | 45.0% | 41.0% |
| 2009 | 19.0% | 42.0% | 38.0% |
| 2008 | 11.0% | 37.0% | 33.0% |
Source: CA Department of Education 2009-2010
School Map and Similar Schools Nearby
Click to Activate Map of Nearby School Campuses
Private
Public
This School
Similar Schools Nearby
| Options for Youth-San Juan School KG-12 | 1,207 Students | 2.8 miles away | Not Yet Rated | |
| Heritage Peak Charter School KG-12 | 1,034 Students | 2.9 miles away | ![]() 1 out of 5 | - |
| Futures High School 7-12 | 288 Students | 3.2 miles away | Not Yet Rated | - |
| Community Collaborative Charter School KG-12 | 842 Students | 3.2 miles away | Not Yet Rated | - |
| Community Outreach Academy KG-12 | 1,027 Students | 3.5 miles away | Not Yet Rated | - |
| Choices Charter School 7-12 | 236 Students | 3.7 miles away | Not Yet Rated | |
| California Aerospace Academy 7-12 | 158 Students | 3.8 miles away | Not Yet Rated | - |
| Muir Charter School 9-12 | 1,394 Students | 5.3 miles away | Not Yet Rated | |
| Global Youth Charter High School 9-12 | 102 Students | 5.7 miles away | Not Yet Rated | |
| Higher Learning Academy KG-12 | 137 Students | 6.0 miles away | Not Yet Rated | - |
Compare This School To Nearby Schools ->
School Community Forum

Join a discussion about Visions in Education School and talk to others in the community including students, parents, teachers, and administrators.
Popular Discussion Topics
- Admissions and Registration Questions (e.g. Dress Code and Discipline Policy)
- School Calendar and Upcoming Events (e.g. Graduation)
- After School Programs, Extracurricular Activities, and Athletics (e.g. Football)
- News and Announcements (e.g. Yearbook and Class Supply List Details)
- Graduate and Alumni Events (e.g. Organizing Class Reunions)
Navigation
Can't Find What You Are Looking For?
Rankings
Nearby Cities
Sponsored Links
K-12 Articles
It's the Most Wonderful Time of the Year!
For most of the country, school is starting up this week or later this month-at the beginning of...
Break the Cycle: Teen Dating Violence and Prevention Week
February 5 through 9 was "National Teen Dating Violence Awareness and Prevention Week"....
A Cheat Sheet on Cheating
Senior projects are coming due and finals are coming up. Spring has sprung, and with spring comes...

