Bishop's Peak Elementary School
Rating
Not Available
Not Available

No Reviews Yet
Find Old Friends From Bishop's Peak Elementary School
Use the form below to search for alumni from Bishop's Peak Elementary School.
School Description
School Summary and Highlights
- Enrolls 292 elementary school students from grades KG-6
- Ranks 914th out of 5,423 elementary schools in CA.
- 2010 Overall School AYP Met Status: Yes
Additional Contact Information
- Mailing Address: 451 Jaycee Dr., San Luis Obispo, CA 93405
School District Details
- San Luis Coastal Unified School District
- Per-Pupil Spending: $9,918
- Graduation Rate: 89.8%
- Dropout Rate: 0.9%
- Students Per Teacher: 19.5
- Enrolled Students: 7,236
Faculty Details and Student Enrollment
Students and Faculty
- Total Students Enrolled: 292
- Total Full Time "Equivalent" Teachers: 15.8
- Average Student-To-Teacher Ratio: 18.5
Students Gender Breakdown
- Males: 154 (52.7%)
- Females: 138 (47.3%)
Free Lunch Student Eligibility Breakdown
- Eligible for Reduced Lunch: 11 (3.8%)
- Eligible for Free Lunch: 52 (17.8%)
- Eligible for Either Reduced or Free Lunch: 63 (21.6%)
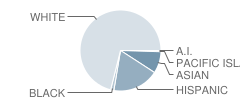
Student Enrollment Distribution by Race / Ethnicity
| Number | Percent | |
|---|---|---|
| American Indian | 1 | 0.3% |
| Black | 4 | 1.4% |
| Asian | 25 | 8.6% |
| Hispanic | 53 | 18.2% |
| White | 203 | 69.5% |
Number of Students Per Grade

| Number | Percent | |
|---|---|---|
| Kindergarten | 48 | 16.4% |
| 1st Grade | 44 | 15.1% |
| 2nd Grade | 52 | 17.8% |
| 3rd Grade | 54 | 18.5% |
| 4th Grade | 30 | 10.3% |
| 5th Grade | 33 | 11.3% |
| 6th Grade | 31 | 10.6% |
Teacher Education Background (2009)
Percent With Master's Degree
School:
29.4%
District:
70.5%
Percent With Bachelor's Degree
School:
5.9%
District:
11.4%
Teacher Credentials & Experience (2009)
Percent of Teachers With Credentials: 100.0%
Number of Certificated Staff: 17.0
Average Number of Years of Teacher Experience: 21.2
Average Age
School:
48.8
District:
50.3
Source: CA Department of Education, Source: NCES 2009-2010
School Ratings and Reviews
Be The First To Review Bishop's Peak Elementary School!
School Map and Similar Schools Nearby
Click to Activate Map of Nearby School Campuses
Private
Public
This School
Similar Schools Nearby
| Teach Elementary School 4-6 | 93 Students | 0 miles away | Not Yet Rated | |
| Pacheco Elementary School KG-6 | 491 Students | 0.4 miles away |  5 out of 5 | |
| Hawthorne Elementary School KG-6 | 328 Students | 2.3 miles away | 5 out of 5 | |
| Smith (C. L.) Elementary School KG-6 | 341 Students | 2.4 miles away | 5 out of 5 | |
| Sinsheimer Elementary School KG-6 | 396 Students | 3.0 miles away | Not Yet Rated | |
| Los Ranchos Elementary School KG-6 | 395 Students | 6.4 miles away | Not Yet Rated | |
| Baywood Elementary School KG-6 | 429 Students | 8.7 miles away | Not Yet Rated | |
| Monarch Grove Elementary School KG-6 | 343 Students | 9.3 miles away | Not Yet Rated | |
| Shell Beach Elementary School KG-6 | 385 Students | 9.5 miles away | 5 out of 5 | |
| San Gabriel Elementary School KG-6 | 533 Students | 11.2 miles away | Not Yet Rated | |
Compare This School To Nearby Schools ->
School Community Forum

Join a discussion about Bishop's Peak Elementary School and talk to others in the community including students, parents, teachers, and administrators.
Popular Discussion Topics
- Admissions and Registration Questions (e.g. Dress Code and Discipline Policy)
- School Calendar and Upcoming Events (e.g. Graduation)
- After School Programs, Extracurricular Activities, and Athletics (e.g. Football)
- News and Announcements (e.g. Yearbook and Class Supply List Details)
- Graduate and Alumni Events (e.g. Organizing Class Reunions)
Navigation
Can't Find What You Are Looking For?
Rankings
Nearby Cities
Sponsored Links
K-12 Articles

Teacher Tenure: A Double-Edged Sword
Teacher Tenure (the policy making it almost impossible to fire teachers) has noble roots. It was...
Teacher Tenure (the policy making it almost impossible to fire teachers) has noble roots. It was...

Idle Hands
The worst affliction affecting our kids today is not teen pregnancy, drugs and alcohol, or...
The worst affliction affecting our kids today is not teen pregnancy, drugs and alcohol, or...

Special Needs Education: Your Child, Your Rights
Many children today have special needs that make it difficult for them to learn. It's imperative...
Many children today have special needs that make it difficult for them to learn. It's imperative...