Bayside Middle School
Rating
Not Available
Not Available

No Reviews Yet
Find Old Friends From Bayside Middle School
Use the form below to search for alumni from Bayside Middle School.
School Description
School Summary and Highlights
- Enrolls 490 middle school students from grades 6-8
- Ranks 1599th out of 2,050 middle schools in CA.
- 2010 Overall School AYP Met Status: No
Additional Contact Information
- Mailing Address: 2025 Kehoe Ave., San Mateo, CA 94403
School Operational Details
- Title I Eligible
School District Details
- San Mateo-Foster City Elementary School District
- Per-Pupil Spending: $9,135
- Students Per Teacher: 20.7
- Enrolled Students: 10,607
Faculty Details and Student Enrollment
Students and Faculty
- Total Students Enrolled: 490
- Total Full Time "Equivalent" Teachers: 26.5
- Average Student-To-Teacher Ratio: 18.5
Students Gender Breakdown
- Males: 240 (49.0%)
- Females: 250 (51.0%)
Free Lunch Student Eligibility Breakdown
- Eligible for Reduced Lunch: 68 (13.9%)
- Eligible for Free Lunch: 231 (47.1%)
- Eligible for Either Reduced or Free Lunch: 299 (61.0%)
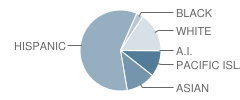
Student Enrollment Distribution by Race / Ethnicity
| Number | Percent | |
|---|---|---|
| American Indian | 1 | 0.2% |
| Black | 13 | 2.7% |
| Asian | 56 | 11.4% |
| Hispanic | 282 | 57.6% |
| White | 75 | 15.3% |
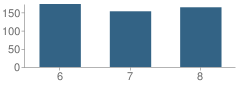
Number of Students Per Grade
| Number | Percent | |
|---|---|---|
| 6th Grade | 173 | 35.3% |
| 7th Grade | 153 | 31.2% |
| 8th Grade | 164 | 33.5% |
Teacher Education Background (2009)
Percent With Ph.D.
School:
3.1%
District:
17.9%
Percent With Master's Degree
School:
18.8%
District:
46.2%
Percent With Bachelor's Degree
School:
18.8%
District:
20.5%
Teacher Credentials & Experience (2009)
Percent of Teachers With Credentials: 92.3%
Number of Certificated Staff: 32.0
Average Number of Years of Teacher Experience: 11.7
Average Age
School:
42.5
District:
45.8
Source: CA Department of Education, Source: NCES 2009-2010
School Ratings and Reviews
Be The First To Review Bayside Middle School!
School Map and Similar Schools Nearby
Click to Activate Map of Nearby School Campuses
Private
Public
This School
Similar Schools Nearby
| North Shoreview Elementary School KG-8 | 336 Students | 1.3 miles away | Not Yet Rated | |
| Borel Middle School 6-8 | 908 Students | 1.9 miles away | Not Yet Rated | |
| Bowditch Middle School 6-8 | 952 Students | 2.6 miles away | Not Yet Rated | |
| Abbott Middle School 6-8 | 749 Students | 2.6 miles away | Not Yet Rated | |
| Central Elementary School KG-6 | 493 Students | 3.0 miles away | Not Yet Rated | |
| Nesbit Elementary School KG-6 | 513 Students | 3.1 miles away | Not Yet Rated | |
| Cipriani Elementary School KG-6 | 394 Students | 3.5 miles away | Not Yet Rated | |
| Crocker Middle School 6-8 | 493 Students | 3.7 miles away |  5 out of 5 | |
| Sandpiper Elementary School 1-6 | 645 Students | 3.8 miles away | Not Yet Rated | |
| Ralston Intermediate School 6-9 | 883 Students | 4.0 miles away | Not Yet Rated | |
Compare This School To Nearby Schools ->
School Community Forum

Join a discussion about Bayside Middle School and talk to others in the community including students, parents, teachers, and administrators.
Popular Discussion Topics
- Admissions and Registration Questions (e.g. Dress Code and Discipline Policy)
- School Calendar and Upcoming Events (e.g. Graduation)
- After School Programs, Extracurricular Activities, and Athletics (e.g. Football)
- News and Announcements (e.g. Yearbook and Class Supply List Details)
- Graduate and Alumni Events (e.g. Organizing Class Reunions)
Navigation
Can't Find What You Are Looking For?
Rankings
Nearby Cities
Sponsored Links
K-12 Articles

Tips for Easing Your Child's Back to School Stress
Do you remember the roller coaster of emotions that you experienced as a child when the day for...
Do you remember the roller coaster of emotions that you experienced as a child when the day for...

What to Do when Your Child Hates School
All kids grumble about going to school at one time or another. This is perfectly normal, but what...
All kids grumble about going to school at one time or another. This is perfectly normal, but what...

The First Day of School
The first day of kindergarten is a rite of passage for any student. Every mother cries and...
The first day of kindergarten is a rite of passage for any student. Every mother cries and...