Capuchino High School

No Reviews Yet
Find Old Friends From Capuchino High School
Use the form below to search for alumni from Capuchino High School.
School Description
School Summary and Highlights
- Enrolls 1,161 high school students from grades 9-12
- Ranks 673rd out of 1,197 high schools in CA.
- 2010 Overall School AYP Met Status: No
Additional Contact Information
- Mailing Address: 1501 Magnolia Dr., San Bruno, CA 94066
School Operational Details
- Title I Eligible
School District Details
- San Mateo Union High School District
- Per-Pupil Spending: $10,479
- Dropout Rate: 1.5%
- Students Per Teacher: 21.5
- Enrolled Students: 8,478
Faculty Details and Student Enrollment
Students and Faculty
- Total Students Enrolled: 1,161
- Total Full Time "Equivalent" Teachers: 55.6
- Average Student-To-Teacher Ratio: 20.9
Students Gender Breakdown
- Males: 579 (49.9%)
- Females: 582 (50.1%)
Free Lunch Student Eligibility Breakdown
- Eligible for Reduced Lunch: 86 (7.4%)
- Eligible for Free Lunch: 236 (20.3%)
- Eligible for Either Reduced or Free Lunch: 322 (27.7%)
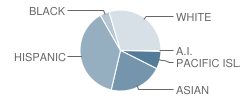
Student Enrollment Distribution by Race / Ethnicity

| Number | Percent | |
|---|---|---|
| American Indian | 6 | 0.5% |
| Black | 44 | 3.8% |
| Asian | 246 | 21.2% |
| Hispanic | 439 | 37.8% |
| White | 342 | 29.5% |
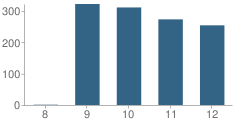
Number of Students Per Grade

| Number | Percent | |
|---|---|---|
| 8th Grade | 1 | 0.09% |
| 9th Grade | 322 | 27.7% |
| 10th Grade | 311 | 26.8% |
| 11th Grade | 273 | 23.5% |
| 12th Grade | 254 | 21.9% |
Graduates Information (2010)
Graduation Rate
School:
91.8%
District:
92.3%
State:
78.6%
Teacher Education Background (2009)
Percent With Master's Degree
School:
12.7%
District:
14.8%
Percent With Bachelor's Degree: 5.6%
Teacher Credentials & Experience (2009)
Percent of Teachers With Emergency Credentials: 1.6%
Percent of Teachers With Credentials: 96.8%
Number of Certificated Staff: 71.0
Average Number of Years of Teacher Experience: 13.5
Average Age
School:
41.5
District:
50.7
Source: CA Department of Education, Source: NCES 2009-2010
School Ratings and Reviews
Be The First To Review Capuchino High School!
Sponsored Links
Test Scores and Performance Information
Overall School Rating
How is this determined?
The overall school rating shows that Capuchino High School performed on average about the same as other schools across the state on CST state exams in the following subjects:
- CST Algebra I
- CST Algebra II
- CST Biology
- CST Chemistry
- CST English-Language Arts
- CST Geometry
- CST Integrated/Coordinated Science
- CST Physics
- CST Science
- CST Summative High School Math
- CST U.S. History
- CST World History
AYP Results (2010)
Overall AYP Met: No
ELA AYP Met: No
Math AYP Met: No
Program Improvement (PI) Requirement Under NCLB (2010)
First Year PI Requirement was Implemented: 2010-2011
School's Placement Under NCLB: Year 1
ACT Exam Results (2009)
Percent of Students Taking ACT Exam: 17.9%
Average Combined Score: 22.9
Percent Scoring At or Above 21: 62.8%
SAT Exam Results (2009)
Percent of Students Taking SAT Exam: 41.3%
Average Combined Score: 1,528.1
Critical Reading Average: 506.8
Math Average: 514.2
Writing Average: 507.1
Percent Scoring At or Above 1500: 55.6%
CST - Test Proficiency by Grade and Subject
Grade 9 - % of students at or above proficiency
| School | District | State | |
|---|---|---|---|
| CST Algebra I Test | |||
| 2010 | 16.0% | 31.0% | 22.0% |
| 2009 | 12.0% | 24.0% | 21.0% |
| 2008 | 17.0% | 21.0% | 18.0% |
| CST English-Language Arts Test | |||
| 2010 | 53.0% | 67.0% | 54.0% |
| 2009 | 47.0% | 64.0% | 50.0% |
| 2008 | 49.0% | 64.0% | 49.0% |
| CST Geometry Test | |||
| 2010 | 56.0% | 71.0% | 46.0% |
| 2009 | 43.0% | 68.0% | 47.0% |
| 2008 | 49.0% | 65.0% | 43.0% |
| CST Physics Test | |||
| 2010 | 16.0% | 17.0% | 40.0% |
| CST Algebra II Test | |||
| 2009 | 17.0% | 75.0% | 65.0% |
| CST Chemistry Test | |||
| 2009 | 25.0% | 28.0% | 44.0% |
| 2008 | 31.0% | 31.0% | 44.0% |
| CST Integrated/Coordinated Science Test | |||
| 2009 | 8.0% | 8.0% | 15.0% |
| 2008 | 9.0% | 7.0% | 5.0% |
Grade 10 - % of students at or above proficiency
| School | District | State | |
|---|---|---|---|
| CST Algebra I Test | |||
| 2010 | 4.0% | 5.0% | 12.0% |
| 2009 | 8.0% | 7.0% | 11.0% |
| 2008 | 10.0% | 8.0% | 9.0% |
| CST Algebra II Test | |||
| 2010 | 54.0% | 47.0% | 40.0% |
| 2009 | 40.0% | 40.0% | 37.0% |
| 2008 | 29.0% | 48.0% | 36.0% |
| CST Chemistry Test | |||
| 2010 | 4.0% | 45.0% | 47.0% |
| 2009 | 11.0% | 45.0% | 44.0% |
| 2008 | 12.0% | 46.0% | 41.0% |
| CST English-Language Arts Test | |||
| 2010 | 45.0% | 62.0% | 45.0% |
| 2009 | 49.0% | 60.0% | 44.0% |
| 2008 | 41.0% | 57.0% | 41.0% |
| CST Geometry Test | |||
| 2010 | 10.0% | 16.0% | 14.0% |
| 2009 | 14.0% | 18.0% | 14.0% |
| 2008 | 11.0% | 15.0% | 12.0% |
| CST Physics Test | |||
| 2010 | 27.0% | 31.0% | 44.0% |
| 2009 | 40.0% | 49.0% | 40.0% |
| 2008 | 73.0% | 80.0% | 36.0% |
| CST Science Test | |||
| 2010 | 21.0% | 57.0% | 46.0% |
| 2009 | 23.0% | 54.0% | 44.0% |
| 2008 | 25.0% | 56.0% | 40.0% |
| CST World History Test | |||
| 2010 | 41.0% | 62.0% | 42.0% |
| 2009 | 41.0% | 57.0% | 38.0% |
| 2008 | 39.0% | 55.0% | 33.0% |
| CST Integrated/Coordinated Science Test | |||
| 2009 | 2.0% | 1.0% | 9.0% |
| 2008 | 3.0% | 1.0% | 7.0% |
| CST Biology Test | |||
| 2008 | 6.0% | 35.0% | 35.0% |
Grade 11 - % of students at or above proficiency
| School | District | State | |
|---|---|---|---|
| CST Algebra II Test | |||
| 2010 | 20.0% | 10.0% | 14.0% |
| 2009 | 7.0% | 10.0% | 12.0% |
| 2008 | 5.0% | 17.0% | 11.0% |
| CST Biology Test | |||
| 2010 | 59.0% | 62.0% | 46.0% |
| 2009 | 45.0% | 56.0% | 41.0% |
| 2008 | 42.0% | 54.0% | 39.0% |
| CST English-Language Arts Test | |||
| 2010 | 44.0% | 55.0% | 42.0% |
| 2009 | 39.0% | 57.0% | 40.0% |
| 2008 | 38.0% | 52.0% | 37.0% |
| CST Summative High School Math Test | |||
| 2010 | 45.0% | 55.0% | 50.0% |
| 2009 | 35.0% | 55.0% | 47.0% |
| 2008 | 55.0% | 60.0% | 43.0% |
| CST U.S. History Test | |||
| 2010 | 42.0% | 59.0% | 45.0% |
| 2009 | 38.0% | 60.0% | 44.0% |
| 2008 | 46.0% | 56.0% | 38.0% |
| CST World History Test | |||
| 2010 | 15.0% | 20.0% | 15.0% |
| CST Algebra I Test | |||
| 2009 | 4.0% | 4.0% | 8.0% |
| 2008 | 5.0% | 3.0% | 5.0% |
| CST Geometry Test | |||
| 2009 | 1.0% | 6.0% | 7.0% |
| 2008 | 5.0% | 8.0% | 6.0% |
| CST Integrated/Coordinated Science Test | |||
| 2009 | 5.0% | 14.0% | 11.0% |
| 2008 | 4.0% | 4.0% | 10.0% |
| CST Chemistry Test | |||
| 2008 | 4.0% | 29.0% | 25.0% |
End of Course - % of students at or above proficiency
| School | District | State | |
|---|---|---|---|
| CST Algebra I Test | |||
| 2010 | 12.0% | 25.0% | 31.0% |
| 2009 | 11.0% | 18.0% | 28.0% |
| 2008 | 13.0% | 16.0% | 25.0% |
| CST Algebra II Test | |||
| 2010 | 37.0% | 38.0% | 31.0% |
| 2009 | 24.0% | 34.0% | 28.0% |
| 2008 | 19.0% | 39.0% | 27.0% |
| CST Biology Test | |||
| 2010 | 57.0% | 64.0% | 46.0% |
| 2009 | 41.0% | 57.0% | 42.0% |
| 2008 | 38.0% | 56.0% | 42.0% |
| CST Chemistry Test | |||
| 2010 | 4.0% | 41.0% | 38.0% |
| 2009 | 16.0% | 41.0% | 36.0% |
| 2008 | 17.0% | 41.0% | 32.0% |
| CST Geometry Test | |||
| 2010 | 17.0% | 34.0% | 27.0% |
| 2009 | 18.0% | 35.0% | 26.0% |
| 2008 | 18.0% | 30.0% | 24.0% |
| CST Physics Test | |||
| 2010 | 19.0% | 41.0% | 49.0% |
| 2009 | 37.0% | 58.0% | 46.0% |
| 2008 | 69.0% | 56.0% | 43.0% |
| CST Summative High School Math Test | |||
| 2010 | 45.0% | 61.0% | 54.0% |
| 2009 | 35.0% | 60.0% | 50.0% |
| 2008 | 57.0% | 65.0% | 47.0% |
| CST World History Test | |||
| 2010 | 40.0% | 61.0% | 41.0% |
| 2009 | 40.0% | 56.0% | 38.0% |
| 2008 | 39.0% | 55.0% | 33.0% |
| CST Integrated/Coordinated Science Test | |||
| 2009 | 6.0% | 11.0% | 13.0% |
| 2008 | 6.0% | 6.0% | 11.0% |
Source: CA Department of Education 2009-2010
School Map and Similar Schools Nearby
Click to Activate Map of Nearby School Campuses
Private
Public
This School
Similar Schools Nearby
| Mills High School 9-12 | 1,469 Students | 1.3 miles away | Not Yet Rated | |
| South San Francisco High School 9-12 | 1,517 Students | 2.9 miles away | Not Yet Rated | |
| Burlingame High School 9-12 | 1,348 Students | 3.6 miles away | Not Yet Rated | |
| Terra Nova High School 9-12 | 1,367 Students | 4.0 miles away | Not Yet Rated | |
| El Camino High School 9-12 | 1,483 Students | 4.5 miles away | ![]() 5 out of 5 | |
| San Mateo High School 9-12 | 1,349 Students | 4.7 miles away | Not Yet Rated | |
| Aragon High School 9-12 | 1,632 Students | 5.8 miles away | Not Yet Rated | |
| Westmoor High School 9-12 | 1,817 Students | 6.7 miles away | Not Yet Rated | |
| Jefferson High School 9-12 | 1,179 Students | 6.9 miles away | Not Yet Rated | |
| Hillsdale High School 9-12 | 1,273 Students | 7.3 miles away | Not Yet Rated | |
Compare This School To Nearby Schools ->
School Community Forum

Join a discussion about Capuchino High School and talk to others in the community including students, parents, teachers, and administrators.
Popular Discussion Topics
- Admissions and Registration Questions (e.g. Dress Code and Discipline Policy)
- School Calendar and Upcoming Events (e.g. Graduation)
- After School Programs, Extracurricular Activities, and Athletics (e.g. Football)
- News and Announcements (e.g. Yearbook and Class Supply List Details)
- Graduate and Alumni Events (e.g. Organizing Class Reunions)
Navigation
Can't Find What You Are Looking For?
Rankings
Nearby Cities
Sponsored Links
K-12 Articles
The First Day of School
The first day of kindergarten is a rite of passage for any student. Every mother cries and...
Parent and Family Involvement in School
When visiting my grandson's school, I often hear administrators and teachers complaining that not...
Break the Cycle: Teen Dating Violence and Prevention Week
February 5 through 9 was "National Teen Dating Violence Awareness and Prevention Week"....

