Hillsdale High School

No Reviews Yet
Find Old Friends From Hillsdale High School
Use the form below to search for alumni from Hillsdale High School.
School Description
School Summary and Highlights
- Enrolls 1,273 high school students from grades 9-12
- Ranks 374th out of 1,197 high schools in CA.
- 2010 Overall School AYP Met Status: No
Additional Contact Information
- Mailing Address: 3115 Del Monte St., San Mateo, CA 94403
School Operational Details
- Title I Eligible
School District Details
- San Mateo Union High School District
- Per-Pupil Spending: $10,479
- Dropout Rate: 1.5%
- Students Per Teacher: 21.5
- Enrolled Students: 8,478
Faculty Details and Student Enrollment
Students and Faculty
- Total Students Enrolled: 1,273
- Total Full Time "Equivalent" Teachers: 65.4
- Average Student-To-Teacher Ratio: 19.5
Students Gender Breakdown
- Males: 668 (52.5%)
- Females: 605 (47.5%)
Free Lunch Student Eligibility Breakdown
- Eligible for Reduced Lunch: 63 (4.9%)
- Eligible for Free Lunch: 173 (13.6%)
- Eligible for Either Reduced or Free Lunch: 236 (18.5%)
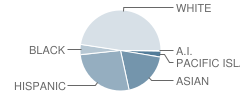
Student Enrollment Distribution by Race / Ethnicity

| Number | Percent | |
|---|---|---|
| American Indian | 5 | 0.4% |
| Black | 53 | 4.2% |
| Asian | 241 | 18.9% |
| Hispanic | 339 | 26.6% |
| White | 602 | 47.3% |
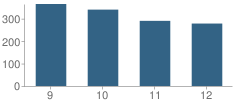
Number of Students Per Grade

| Number | Percent | |
|---|---|---|
| 9th Grade | 365 | 28.7% |
| 10th Grade | 340 | 26.7% |
| 11th Grade | 290 | 22.8% |
| 12th Grade | 278 | 21.8% |
Graduates Information (2010)
Graduation Rate
School:
91.9%
District:
92.3%
State:
78.6%
Teacher Education Background (2009)
Percent With Master's Degree
School:
20.3%
District:
14.8%
Percent With Bachelor's Degree: 5.4%
Teacher Credentials & Experience (2009)
Percent of Teachers With Credentials: 98.5%
Number of Certificated Staff: 74.0
Average Number of Years of Teacher Experience: 11.3
Average Age
School:
39.2
District:
50.7
Source: CA Department of Education, Source: NCES 2009-2010
School Ratings and Reviews
Be The First To Review Hillsdale High School!
Sponsored Links
Test Scores and Performance Information
Overall School Rating
How is this determined?
The overall school rating shows that Hillsdale High School performed on average better than many other schools across the state on CST state exams in the following subjects:
- CST Algebra I
- CST Algebra II
- CST Biology
- CST Chemistry
- CST English-Language Arts
- CST General Mathematics
- CST Geometry
- CST Integrated Math 2
- CST Integrated/Coordinated Science
- CST Physics
- CST Science
- CST Summative High School Math
- CST U.S. History
- CST World History
AYP Results (2010)
Overall AYP Met: No
ELA AYP Met: No
Math AYP Met: No
ACT Exam Results (2009)
Percent of Students Taking ACT Exam: 17.9%
Average Combined Score: 24.5
Percent Scoring At or Above 21: 80.9%
SAT Exam Results (2009)
Percent of Students Taking SAT Exam: 54.2%
Average Combined Score: 1,652.3
Critical Reading Average: 538.7
Math Average: 570.0
Writing Average: 543.5
Percent Scoring At or Above 1500: 70.4%
CST - Test Proficiency by Grade and Subject
Grade 9 - % of students at or above proficiency
| School | District | State | |
|---|---|---|---|
| CST Algebra I Test | |||
| 2010 | 34.0% | 31.0% | 22.0% |
| 2009 | 29.0% | 24.0% | 21.0% |
| 2008 | 18.0% | 21.0% | 18.0% |
| CST Algebra II Test | |||
| 2010 | 100.0% | 84.0% | 69.0% |
| 2009 | 74.0% | 75.0% | 65.0% |
| 2008 | 60.0% | 82.0% | 66.0% |
| CST Biology Test | |||
| 2010 | 69.0% | 71.0% | 55.0% |
| 2009 | 64.0% | 64.0% | 51.0% |
| 2008 | 57.0% | 63.0% | 52.0% |
| CST English-Language Arts Test | |||
| 2010 | 64.0% | 67.0% | 54.0% |
| 2009 | 57.0% | 64.0% | 50.0% |
| 2008 | 60.0% | 64.0% | 49.0% |
| CST Geometry Test | |||
| 2010 | 77.0% | 71.0% | 46.0% |
| 2009 | 73.0% | 68.0% | 47.0% |
| 2008 | 61.0% | 65.0% | 43.0% |
| CST General Mathematics Test | |||
| 2009 | 6.0% | 5.0% | 17.0% |
Grade 10 - % of students at or above proficiency
| School | District | State | |
|---|---|---|---|
| CST Algebra I Test | |||
| 2010 | 2.0% | 5.0% | 12.0% |
| 2009 | 4.0% | 7.0% | 11.0% |
| CST Algebra II Test | |||
| 2010 | 34.0% | 47.0% | 40.0% |
| 2009 | 38.0% | 40.0% | 37.0% |
| 2008 | 46.0% | 48.0% | 36.0% |
| CST Biology Test | |||
| 2010 | 24.0% | 41.0% | 38.0% |
| 2009 | 12.0% | 27.0% | 34.0% |
| 2008 | 14.0% | 35.0% | 35.0% |
| CST Chemistry Test | |||
| 2010 | 42.0% | 45.0% | 47.0% |
| 2009 | 39.0% | 45.0% | 44.0% |
| 2008 | 31.0% | 46.0% | 41.0% |
| CST English-Language Arts Test | |||
| 2010 | 53.0% | 62.0% | 45.0% |
| 2009 | 54.0% | 60.0% | 44.0% |
| 2008 | 49.0% | 57.0% | 41.0% |
| CST Geometry Test | |||
| 2010 | 21.0% | 16.0% | 14.0% |
| 2009 | 15.0% | 18.0% | 14.0% |
| 2008 | 11.0% | 15.0% | 12.0% |
| CST Science Test | |||
| 2010 | 55.0% | 57.0% | 46.0% |
| 2009 | 56.0% | 54.0% | 44.0% |
| 2008 | 59.0% | 56.0% | 40.0% |
| CST Summative High School Math Test | |||
| 2010 | 75.0% | 85.0% | 75.0% |
| 2009 | 80.0% | 89.0% | 71.0% |
| 2008 | 81.0% | 86.0% | 68.0% |
| CST World History Test | |||
| 2010 | 61.0% | 62.0% | 42.0% |
| 2009 | 62.0% | 57.0% | 38.0% |
| 2008 | 56.0% | 55.0% | 33.0% |
Grade 11 - % of students at or above proficiency
| School | District | State | |
|---|---|---|---|
| CST Algebra II Test | |||
| 2010 | 9.0% | 10.0% | 14.0% |
| 2009 | 8.0% | 10.0% | 12.0% |
| 2008 | 24.0% | 17.0% | 11.0% |
| CST Biology Test | |||
| 2010 | 82.0% | 62.0% | 46.0% |
| 2009 | 64.0% | 56.0% | 41.0% |
| 2008 | 68.0% | 54.0% | 39.0% |
| CST Chemistry Test | |||
| 2010 | 33.0% | 32.0% | 30.0% |
| 2009 | 32.0% | 30.0% | 27.0% |
| 2008 | 19.0% | 29.0% | 25.0% |
| CST English-Language Arts Test | |||
| 2010 | 50.0% | 55.0% | 42.0% |
| 2009 | 46.0% | 57.0% | 40.0% |
| 2008 | 55.0% | 52.0% | 37.0% |
| CST Geometry Test | |||
| 2010 | 5.0% | 4.0% | 6.0% |
| 2009 | - | - | - |
| 2008 | 9.0% | 8.0% | 6.0% |
| CST Integrated Math 2 Test | |||
| 2010 | 14.0% | 26.0% | 19.0% |
| 2009 | 7.0% | 14.0% | 15.0% |
| CST Physics Test | |||
| 2010 | 42.0% | 51.0% | 53.0% |
| 2009 | 42.0% | 59.0% | 50.0% |
| 2008 | 52.0% | 54.0% | 47.0% |
| CST Summative High School Math Test | |||
| 2010 | 51.0% | 55.0% | 50.0% |
| 2009 | 51.0% | 55.0% | 47.0% |
| 2008 | 54.0% | 60.0% | 43.0% |
| CST U.S. History Test | |||
| 2010 | 51.0% | 59.0% | 45.0% |
| 2009 | 54.0% | 60.0% | 44.0% |
| 2008 | 48.0% | 56.0% | 38.0% |
| CST Algebra I Test | |||
| 2008 | 6.0% | 3.0% | 5.0% |
End of Course - % of students at or above proficiency
| School | District | State | |
|---|---|---|---|
| CST Algebra I Test | |||
| 2010 | 27.0% | 25.0% | 31.0% |
| 2009 | 24.0% | 18.0% | 28.0% |
| 2008 | 14.0% | 16.0% | 25.0% |
| CST Algebra II Test | |||
| 2010 | 27.0% | 38.0% | 31.0% |
| 2009 | 29.0% | 34.0% | 28.0% |
| 2008 | 36.0% | 39.0% | 27.0% |
| CST Biology Test | |||
| 2010 | 67.0% | 64.0% | 46.0% |
| 2009 | 58.0% | 57.0% | 42.0% |
| 2008 | 53.0% | 56.0% | 42.0% |
| CST Chemistry Test | |||
| 2010 | 41.0% | 41.0% | 38.0% |
| 2009 | 38.0% | 41.0% | 36.0% |
| 2008 | 30.0% | 41.0% | 32.0% |
| CST Geometry Test | |||
| 2010 | 36.0% | 34.0% | 27.0% |
| 2009 | 31.0% | 35.0% | 26.0% |
| 2008 | 23.0% | 30.0% | 24.0% |
| CST Integrated Math 2 Test | |||
| 2010 | 13.0% | 29.0% | 27.0% |
| 2009 | 11.0% | 16.0% | 25.0% |
| CST Integrated/Coordinated Science Test | |||
| 2010 | 14.0% | 21.0% | 16.0% |
| CST Physics Test | |||
| 2010 | 41.0% | 41.0% | 49.0% |
| 2009 | 42.0% | 58.0% | 46.0% |
| 2008 | 53.0% | 56.0% | 43.0% |
| CST Summative High School Math Test | |||
| 2010 | 59.0% | 61.0% | 54.0% |
| 2009 | 56.0% | 60.0% | 50.0% |
| 2008 | 59.0% | 65.0% | 47.0% |
| CST World History Test | |||
| 2010 | 61.0% | 61.0% | 41.0% |
| 2009 | 61.0% | 56.0% | 38.0% |
| 2008 | 56.0% | 55.0% | 33.0% |
| CST General Mathematics Test | |||
| 2009 | 6.0% | 5.0% | 26.0% |
Source: CA Department of Education 2009-2010
School Map and Similar Schools Nearby
Click to Activate Map of Nearby School Campuses
Private
Public
This School
Similar Schools Nearby
| Ralston Intermediate School 6-9 | 883 Students | 1.5 miles away | Not Yet Rated | |
| Aragon High School 9-12 | 1,632 Students | 1.5 miles away | Not Yet Rated | |
| Carlmont High School 9-12 | 2,111 Students | 2.2 miles away | ![]() 5 out of 5 | |
| San Mateo High School 9-12 | 1,349 Students | 3.3 miles away | Not Yet Rated | |
| Burlingame High School 9-12 | 1,348 Students | 3.9 miles away | Not Yet Rated | |
| Sequoia High School 9-12 | 1,818 Students | 5.3 miles away | Not Yet Rated | |
| Mills High School 9-12 | 1,469 Students | 6.0 miles away | Not Yet Rated | |
| Capuchino High School 9-12 | 1,161 Students | 7.3 miles away | Not Yet Rated | |
| Half Moon Bay High School 9-12 | 987 Students | 7.4 miles away | ![]() 4 out of 5 | |
| Woodside High School 9-12 | 1,835 Students | 7.7 miles away | Not Yet Rated | |
Compare This School To Nearby Schools ->
School Community Forum

Join a discussion about Hillsdale High School and talk to others in the community including students, parents, teachers, and administrators.
Popular Discussion Topics
- Admissions and Registration Questions (e.g. Dress Code and Discipline Policy)
- School Calendar and Upcoming Events (e.g. Graduation)
- After School Programs, Extracurricular Activities, and Athletics (e.g. Football)
- News and Announcements (e.g. Yearbook and Class Supply List Details)
- Graduate and Alumni Events (e.g. Organizing Class Reunions)
Navigation
Can't Find What You Are Looking For?
Rankings
Nearby Cities
Sponsored Links
K-12 Articles
Teaching Children Respect
Statistics prove that there are many different family types in today's society. Grandparents or a...
Teaching Children with Learning Disabilities to Make Friends
Children with learning disabilities often have trouble making and retaining friendships. Some kids...
Simple Math ... a Simple Gift
Math affects every aspect of our lives-from balancing the checkbook to estimating the amount of...


