Lone Star Elementary School
Rating
Not Available
Not Available

No Reviews Yet
Find Old Friends From Lone Star Elementary School
Use the form below to search for alumni from Lone Star Elementary School.
School Description
School Summary and Highlights
- Enrolls 560 elementary school students from grades KG-6
- Ranks 1794th out of 5,423 elementary schools in CA.
- 2010 Overall School AYP Met Status: Yes
Additional Contact Information
- Mailing Address: 2617 South Fowler Ave., Fresno, CA 93725
School Operational Details
- Title I EligibleAll students of this school are eligible for participation in authorized programs.
School District Details
- Sanger Unified School District
- Per-Pupil Spending: $8,966
- Graduation Rate: 75.2%
- Dropout Rate: 2.2%
- Students Per Teacher: 20.5
- Enrolled Students: 10,501
Faculty Details and Student Enrollment
Students and Faculty
- Total Students Enrolled: 560
- Total Full Time "Equivalent" Teachers: 30.0
- Average Student-To-Teacher Ratio: 18.7
Students Gender Breakdown
- Males: 272 (48.6%)
- Females: 288 (51.4%)
Free Lunch Student Eligibility Breakdown
- Eligible for Reduced Lunch: 100 (17.9%)
- Eligible for Free Lunch: 296 (52.9%)
- Eligible for Either Reduced or Free Lunch: 396 (70.7%)
Student Enrollment Distribution by Race / Ethnicity
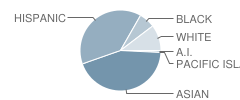
| Number | Percent | |
|---|---|---|
| American Indian | 4 | 0.7% |
| Black | 36 | 6.4% |
| Asian | 245 | 43.8% |
| Hispanic | 216 | 38.6% |
| White | 58 | 10.4% |
Number of Students Per Grade
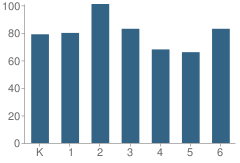
| Number | Percent | |
|---|---|---|
| Kindergarten | 79 | 14.1% |
| 1st Grade | 80 | 14.3% |
| 2nd Grade | 101 | 18.0% |
| 3rd Grade | 83 | 14.8% |
| 4th Grade | 68 | 12.1% |
| 5th Grade | 66 | 11.8% |
| 6th Grade | 83 | 14.8% |
Teacher Education Background (2009)
Percent With Master's Degree
School:
6.7%
District:
27.7%
Percent With Bachelor's Degree
School:
26.7%
District:
32.5%
Teacher Credentials & Experience (2009)
Percent of Teachers With Credentials: 100.0%
Number of Certificated Staff: 30.0
Average Number of Years of Teacher Experience: 8.7
Average Age
School:
36.4
District:
44.1
Source: CA Department of Education, Source: NCES 2009-2010
School Ratings and Reviews
Be The First To Review Lone Star Elementary School!
School Map and Similar Schools Nearby
Click to Activate Map of Nearby School Campuses
Private
Public
This School
Similar Schools Nearby
| Edith B. Storey Elementary School KG-7 | 757 Students | 2.2 miles away | Not Yet Rated | |
| John S. Wash Elementary School KG-6 | 400 Students | 2.4 miles away | Not Yet Rated | |
| Southeast Elementary School KG-6 | 715 Students | 2.5 miles away | Not Yet Rated | - |
| Ayer Elementary School KG-6 | 695 Students | 2.8 miles away |  5 out of 5 | |
| Fancher Creek Elementary School KG-6 | 867 Students | 3.1 miles away | Not Yet Rated | |
| Malaga Elementary School KG-5 | 229 Students | 3.1 miles away | Not Yet Rated | |
| Aynesworth Elementary School KG-6 | 621 Students | 3.2 miles away | Not Yet Rated | |
| David L. Greenberg Elementary School KG-6 | 574 Students | 3.4 miles away | Not Yet Rated | |
| Ezekiel Balderas Elementary School KG-6 | 666 Students | 3.6 miles away | Not Yet Rated | |
| Easterby Elementary School KG-6 | 628 Students | 3.7 miles away | Not Yet Rated | |
Compare This School To Nearby Schools ->
School Community Forum

Join a discussion about Lone Star Elementary School and talk to others in the community including students, parents, teachers, and administrators.
Popular Discussion Topics
- Admissions and Registration Questions (e.g. Dress Code and Discipline Policy)
- School Calendar and Upcoming Events (e.g. Graduation)
- After School Programs, Extracurricular Activities, and Athletics (e.g. Football)
- News and Announcements (e.g. Yearbook and Class Supply List Details)
- Graduate and Alumni Events (e.g. Organizing Class Reunions)
Navigation
Can't Find What You Are Looking For?
Rankings
Nearby Cities
Sponsored Links
K-12 Articles

National Memories
Few events are seared into our memory, and bring the country together-not as Democrat and...
Few events are seared into our memory, and bring the country together-not as Democrat and...

Tips for Purchasing Back to School Supplies
In just a few days, kids from all over the US will be going back to school. Now is the time to take...
In just a few days, kids from all over the US will be going back to school. Now is the time to take...

Teaching Children a Love of History
Parents and grandparents are responsible for teaching children a love of history. To begin, relate...
Parents and grandparents are responsible for teaching children a love of history. To begin, relate...