Lowell Elementary School
Rating
Not Available
Not Available

5 out of 5 | 2 Reviews
Find Old Friends From Lowell Elementary School
Use the form below to search for alumni from Lowell Elementary School.
School Description
School Summary and Highlights
- Enrolls 881 elementary school students from grades KG-5
- Ranks 5064th out of 5,423 elementary schools in CA.
- 2010 Overall School AYP Met Status: No
Additional Contact Information
- Mailing Address: 700 South Flower St., Santa Ana, CA 92703
School Operational Details
- Title I EligibleAll students of this school are eligible for participation in authorized programs.
School District Details
- Santa Ana Unified School District
- Per-Pupil Spending: $9,535
- Graduation Rate: 52.4%
- Dropout Rate: 1.8%
- Students Per Teacher: 24.2
- Enrolled Students: 57,060
Faculty Details and Student Enrollment
Students and Faculty
- Total Students Enrolled: 881
- Total Full Time "Equivalent" Teachers: 40.0
- Average Student-To-Teacher Ratio: 22.0
Students Gender Breakdown
- Males: 465 (52.8%)
- Females: 416 (47.2%)
Free Lunch Student Eligibility Breakdown
- Eligible for Reduced Lunch: 107 (12.1%)
- Eligible for Free Lunch: 747 (84.8%)
- Eligible for Either Reduced or Free Lunch: 854 (96.9%)
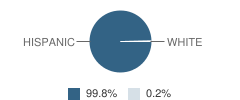
Student Enrollment Distribution by Race / Ethnicity
| Number | Percent | |
|---|---|---|
| American Indian | - | - |
| Black | - | - |
| Asian | - | - |
| Hispanic | 879 | 99.8% |
| White | 2 | 0.2% |
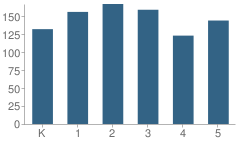
Number of Students Per Grade
| Number | Percent | |
|---|---|---|
| Kindergarten | 132 | 15.0% |
| 1st Grade | 156 | 17.7% |
| 2nd Grade | 167 | 19.0% |
| 3rd Grade | 159 | 18.0% |
| 4th Grade | 123 | 14.0% |
| 5th Grade | 144 | 16.3% |
Teacher Education Background (2009)
Percent With Master's Degree
School:
61.7%
District:
70.1%
Percent With Bachelor's Degree
School:
10.6%
District:
5.1%
Teacher Credentials & Experience (2009)
Percent of Teachers With Credentials: 100.0%
Number of Certificated Staff: 47.0
Average Number of Years of Teacher Experience: 15.3
Average Age
School:
43.6
District:
48.7
Source: CA Department of Education, Source: NCES 2009-2010
School Ratings and Reviews
Overall Rating: 5

5 out of 5 | 2 Reviews
The Overall Rating is the school's average rating from parents, students, school faculty and staff. The highest rating is five apples and the lowest is one apple.
Share Your Review About This School
2 reviews for Lowell Elementary School
- Reviewed by Parent/Guardian on February 09, 2010
- Rating:
 (5 / 5) Flag as inappropriate
 - Lowell
- Reviewed by Parent/Guardian on December 22, 2008
- Rating: (5 / 5) Flag as inappropriate
- This school offers a lot of programs that will have a positive effect on student performance for the future.
School Map and Similar Schools Nearby
Click to Activate Map of Nearby School Campuses
Private
Public
This School
Similar Schools Nearby
| Pio Pico Elementary School KG-5 | 700 Students | 0.1 miles away |  1 out of 5 | |
| Martin Elementary School KG-5 | 725 Students | 0.5 miles away | Not Yet Rated | |
| Martin Luther King Jr. Elementary School KG-5 | 852 Students | 0.6 miles away | Not Yet Rated | |
| Franklin Elementary School KG-5 | 468 Students | 0.6 miles away | Not Yet Rated | |
| Martin R. Heninger Elementary School KG-5 | 776 Students | 0.6 miles away | Not Yet Rated | |
| George Washington Carver Elementary School KG-3 | 586 Students | 0.8 miles away | Not Yet Rated | |
| Lydia Romero-Cruz Elementary School 3-5 | 430 Students | 0.9 miles away | Not Yet Rated | |
| Heroes Elementary School KG-5 | 662 Students | 0.9 miles away | Not Yet Rated | - |
| Jose Sepulveda Elementary School KG-5 | 493 Students | 1.1 miles away | Not Yet Rated | |
| Monte Vista Elementary School KG-5 | 658 Students | 1.1 miles away |  5 out of 5 | |
Compare This School To Nearby Schools ->
School Community Forum

Join a discussion about Lowell Elementary School and talk to others in the community including students, parents, teachers, and administrators.
Popular Discussion Topics
- Admissions and Registration Questions (e.g. Dress Code and Discipline Policy)
- School Calendar and Upcoming Events (e.g. Graduation)
- After School Programs, Extracurricular Activities, and Athletics (e.g. Football)
- News and Announcements (e.g. Yearbook and Class Supply List Details)
- Graduate and Alumni Events (e.g. Organizing Class Reunions)
Navigation
Can't Find What You Are Looking For?
Rankings
Nearby Cities
Sponsored Links
K-12 Articles

Break the Cycle: Teen Dating Violence and Prevention Week
February 5 through 9 was “National Teen Dating Violence Awareness and Prevention Week”....
February 5 through 9 was “National Teen Dating Violence Awareness and Prevention Week”....

Those Pesky Little Transitions
Transitions are rarely easy, yet we have to encounter them every day of our lives. For school-aged...
Transitions are rarely easy, yet we have to encounter them every day of our lives. For school-aged...

Teach Your Child to Write Well
When American children head off to junior kindergarten, they must be ready to learn. It is your...
When American children head off to junior kindergarten, they must be ready to learn. It is your...