Saddleback High School
Rating
Not Available
Not Available

3.5 out of 5 | 4 Reviews
Find Old Friends From Saddleback High School
Use the form below to search for alumni from Saddleback High School.
School Description
School Summary and Highlights
- Enrolls 2,115 high school students from grades 9-12
- Ranks 1046th out of 1,197 high schools in CA.
- 2010 Overall School AYP Met Status: No
School Operational Details
- Title I EligibleAll students of this school are eligible for participation in authorized programs.
School District Details
- Santa Ana Unified School District
- Per-Pupil Spending: $9,535
- Graduation Rate: 52.4%
- Dropout Rate: 1.8%
- Students Per Teacher: 24.2
- Enrolled Students: 57,060
Faculty Details and Student Enrollment
Students and Faculty
- Total Students Enrolled: 2,115
- Total Full Time "Equivalent" Teachers: 84.0
- Average Student-To-Teacher Ratio: 25.2
Students Gender Breakdown
- Males: 1,100 (52.0%)
- Females: 1,015 (48.0%)
Free Lunch Student Eligibility Breakdown
- Eligible for Reduced Lunch: 241 (11.4%)
- Eligible for Free Lunch: 1,307 (61.8%)
- Eligible for Either Reduced or Free Lunch: 1,548 (73.2%)
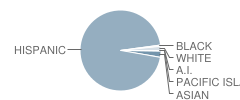
Student Enrollment Distribution by Race / Ethnicity
| Number | Percent | |
|---|---|---|
| American Indian | 2 | 0.09% |
| Black | 12 | 0.6% |
| Asian | 52 | 2.5% |
| Hispanic | 2,005 | 94.8% |
| White | 35 | 1.7% |
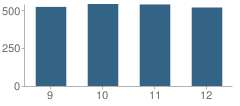
Number of Students Per Grade
| Number | Percent | |
|---|---|---|
| 9th Grade | 521 | 24.6% |
| 10th Grade | 540 | 25.5% |
| 11th Grade | 537 | 25.4% |
| 12th Grade | 517 | 24.4% |
Graduates Information (2010)
Graduation Rate
School:
82.3%
District:
83.6%
State:
78.6%
Teacher Education Background (2009)
Percent With Ph.D.
School:
100.0%
District:
10.7%
Percent With Master's Degree
School:
67.0%
District:
70.1%
Percent With Bachelor's Degree
School:
11.0%
District:
5.1%
Teacher Credentials & Experience (2009)
Percent of Teachers With Emergency Credentials: 8.9%
Percent of Teachers With Credentials: 96.7%
Number of Certificated Staff: 100.0
Average Number of Years of Teacher Experience: 16.4
Average Age
School:
46.7
District:
48.7
Source: CA Department of Education, Source: NCES 2009-2010
School Ratings and Reviews
Overall Rating: 3.5

3.5 out of 5 | 4 Reviews
The Overall Rating is the school's average rating from parents, students, school faculty and staff. The highest rating is five apples and the lowest is one apple.
Share Your Review About This School
4 reviews for Saddleback High School
- Reviewed by Student on March 28, 2010
- Rating:
 (5 / 5) Flag as inappropriate
 - ok, so it doesnt have the best restrooms, and the soccer team isn't that great, but its still a good school!
- Reviewed by Parent/Guardian on January 21, 2010
- Rating:
 (1 / 5) Flag as inappropriate
 - This school is horrible and needs to get remodeled like someone mentioned already and if you want your child to play soccer or join x-country don't bring them here Mel Silva is horrible and the girls soccer team has won 0 soccer games....those coaches are horrible as well...Mel Silva's puppets
- Reviewed by Parent/Guardian on February 20, 2008
- Rating: (5 / 5) Flag as inappropriate
- good
- Reviewed by Student on August 01, 2007
- Rating:
 (3 / 5) Flag as inappropriate
 - some teachers are great, some are horrible, the campus needs to get remodeled and the restrooms are the worst!
School Map and Similar Schools Nearby
Click to Activate Map of Nearby School Campuses
Private
Public
This School
Similar Schools Nearby
| Segerstrom High School 9-12 | 2,408 Students | 1.4 miles away |  5 out of 5 | |
| Valley High School 9-12 | 2,465 Students | 1.6 miles away | 5 out of 5 | |
| Hector G. Godinez School 9-12 | 2,172 Students | 2.0 miles away | Not Yet Rated | - |
| Century High School 9-12 | 2,377 Students | 2.1 miles away | Not Yet Rated | |
| Santa Ana High School 9-12 | 3,435 Students | 2.4 miles away | Not Yet Rated | |
| Occs:chep / Pchs School KG-12 | 1,422 Students | 2.9 miles away | Not Yet Rated | |
| Los Amigos High School 9-12 | 2,253 Students | 3.1 miles away | Not Yet Rated | |
| Costa Mesa High School 7-12 | 1,752 Students | 3.1 miles away | Not Yet Rated | |
| Tustin High School 9-12 | 2,132 Students | 4.0 miles away | Not Yet Rated | |
| Woodbridge High School 9-12 | 2,119 Students | 4.5 miles away | Not Yet Rated | |
Compare This School To Nearby Schools ->
School Community Forum

Join a discussion about Saddleback High School and talk to others in the community including students, parents, teachers, and administrators.
Popular Discussion Topics
- Admissions and Registration Questions (e.g. Dress Code and Discipline Policy)
- School Calendar and Upcoming Events (e.g. Graduation)
- After School Programs, Extracurricular Activities, and Athletics (e.g. Football)
- News and Announcements (e.g. Yearbook and Class Supply List Details)
- Graduate and Alumni Events (e.g. Organizing Class Reunions)
Navigation
Can't Find What You Are Looking For?
Rankings
Nearby Cities
Sponsored Links
K-12 Articles

Keep Morning Stress at a Minimum: Establish a Routine
Morning! It can be a time of stress. The kids are fighting over who gets to use the bathroom first,...
Morning! It can be a time of stress. The kids are fighting over who gets to use the bathroom first,...

Keeping Our Kids Safe in the Post 9/11 World
Recently, radio talk show host and CNN personality did a week-long special entitled "The Perfect...
Recently, radio talk show host and CNN personality did a week-long special entitled "The Perfect...

What to Do when Your Student is Held Back
Kids develop at different speeds, and everyone has different skills and abilities. School is easy...
Kids develop at different speeds, and everyone has different skills and abilities. School is easy...