Taft Elementary School
Rating
Not Available
Not Available

No Reviews Yet
Find Old Friends From Taft Elementary School
Use the form below to search for alumni from Taft Elementary School.
School Description
School Summary and Highlights
- Enrolls 802 elementary school students from grades KG-8
- Ranks 1834th out of 2,050 middle schools in CA.
- 2010 Overall School AYP Met Status: No
School Operational Details
- Title I Eligible
School District Details
- Santa Ana Unified School District
- Per-Pupil Spending: $9,535
- Graduation Rate: 52.4%
- Dropout Rate: 1.8%
- Students Per Teacher: 24.2
- Enrolled Students: 57,060
Faculty Details and Student Enrollment
Students and Faculty
- Total Students Enrolled: 802
- Total Full Time "Equivalent" Teachers: 42.9
- Average Student-To-Teacher Ratio: 18.7
Students Gender Breakdown
- Males: 402 (50.1%)
- Females: 400 (49.9%)
Free Lunch Student Eligibility Breakdown
- Eligible for Reduced Lunch: 129 (16.1%)
- Eligible for Free Lunch: 541 (67.5%)
- Eligible for Either Reduced or Free Lunch: 670 (83.5%)
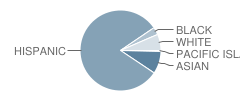
Student Enrollment Distribution by Race / Ethnicity
| Number | Percent | |
|---|---|---|
| American Indian | - | - |
| Black | 24 | 3.0% |
| Asian | 72 | 9.0% |
| Hispanic | 649 | 80.9% |
| White | 52 | 6.5% |
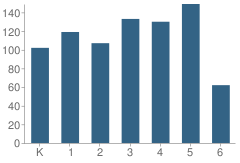
Number of Students Per Grade
| Number | Percent | |
|---|---|---|
| Kindergarten | 102 | 12.7% |
| 1st Grade | 119 | 14.8% |
| 2nd Grade | 107 | 13.3% |
| 3rd Grade | 133 | 16.6% |
| 4th Grade | 130 | 16.2% |
| 5th Grade | 149 | 18.6% |
| 6th Grade | 62 | 7.7% |
Teacher Education Background (2009)
Percent With Master's Degree
School:
76.4%
District:
70.1%
Percent With Bachelor's Degree
School:
12.7%
District:
5.1%
Teacher Credentials & Experience (2009)
Percent of Teachers With Emergency Credentials: 7.4%
Percent of Teachers With Credentials: 92.6%
Number of Certificated Staff: 55.0
Average Number of Years of Teacher Experience: 15.1
Average Age
School:
44.5
District:
48.7
Source: CA Department of Education, Source: NCES 2009-2010
School Ratings and Reviews
Be The First To Review Taft Elementary School!
School Map and Similar Schools Nearby
Click to Activate Map of Nearby School Campuses
Private
Public
This School
Similar Schools Nearby
| Jefferson Elementary School KG-5 | 948 Students | 1.3 miles away | Not Yet Rated | |
| Greenville Fundamental School KG-5 | 934 Students | 1.3 miles away |  5 out of 5 | |
| Monroe Elementary School KG-5 | 459 Students | 1.4 miles away | Not Yet Rated | |
| Manuel Esqueda Elementary School KG-5 | 877 Students | 1.5 miles away | Not Yet Rated | |
| Washington Elementary School KG-5 | 1,055 Students | 1.5 miles away | Not Yet Rated | |
| Jim Thorpe Fundamental School KG-5 | 812 Students | 1.6 miles away | 5 out of 5 | |
| Sonora Elementary School KG-6 | 533 Students | 1.8 miles away | Not Yet Rated | |
| Paularino Elementary School KG-6 | 403 Students | 1.8 miles away | Not Yet Rated | |
| Thomas A. Edison Elementary School KG-5 | 700 Students | 1.9 miles away | Not Yet Rated | |
| Occs:chep / Pchs School KG-12 | 1,422 Students | 1.9 miles away | Not Yet Rated | |
Compare This School To Nearby Schools ->
School Community Forum

Join a discussion about Taft Elementary School and talk to others in the community including students, parents, teachers, and administrators.
Popular Discussion Topics
- Admissions and Registration Questions (e.g. Dress Code and Discipline Policy)
- School Calendar and Upcoming Events (e.g. Graduation)
- After School Programs, Extracurricular Activities, and Athletics (e.g. Football)
- News and Announcements (e.g. Yearbook and Class Supply List Details)
- Graduate and Alumni Events (e.g. Organizing Class Reunions)
Navigation
Can't Find What You Are Looking For?
Rankings
Nearby Cities
Sponsored Links
K-12 Articles

Who is Safe?
Between September 26 and October 2, 2006, there were three deadly school shootings and...
Between September 26 and October 2, 2006, there were three deadly school shootings and...

What to Do when Your Student is Held Back
Kids develop at different speeds, and everyone has different skills and abilities. School is easy...
Kids develop at different speeds, and everyone has different skills and abilities. School is easy...

Those Pesky Little Transitions
Transitions are rarely easy, yet we have to encounter them every day of our lives. For school-aged...
Transitions are rarely easy, yet we have to encounter them every day of our lives. For school-aged...