Orange County High School of the Arts

No Reviews Yet
Find Old Friends From Orange County High School of the Arts
Use the form below to search for alumni from Orange County High School of the Arts.
School Description
School Summary and Highlights
- Enrolls 1,417 middle and high school students from grades 7-12
- Ranks 107th out of 1,197 high schools in CA.
- 2010 Overall School AYP Met Status: Yes
- National Blue Ribbon Schools Award 2006

Additional Contact Information
- Mailing Address: 1010 North Main St., Santa Ana, CA 92701
School Operational Details
- Title I Eligible
- Charter School
School District Details
- Santa Ana Unified School District
- Per-Pupil Spending: $9,535
- Graduation Rate: 52.4%
- Dropout Rate: 1.8%
- Students Per Teacher: 24.2
- Enrolled Students: 57,060
Faculty Details and Student Enrollment
Students and Faculty
- Total Students Enrolled: 1,417
- Total Full Time "Equivalent" Teachers: 47.3
- Average Student-To-Teacher Ratio: 30.0
Students Gender Breakdown
- Males: 367 (25.9%)
- Females: 1,050 (74.1%)
Free Lunch Student Eligibility Breakdown
- Eligible for Reduced Lunch: - (-)
- Eligible for Free Lunch: 110 (7.8%)
- Eligible for Either Reduced or Free Lunch: 110 (7.8%)
Student Enrollment Distribution by Race / Ethnicity

| Number | Percent | |
|---|---|---|
| American Indian | 8 | 0.6% |
| Black | 16 | 1.1% |
| Asian | 207 | 14.6% |
| Hispanic | 299 | 21.1% |
| White | 802 | 56.6% |
Number of Students Per Grade
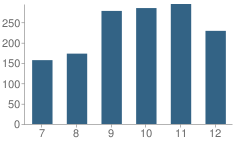
| Number | Percent | |
|---|---|---|
| 7th Grade | 157 | 11.1% |
| 8th Grade | 173 | 12.2% |
| 9th Grade | 278 | 19.6% |
| 10th Grade | 285 | 20.1% |
| 11th Grade | 295 | 20.8% |
| 12th Grade | 229 | 16.2% |
Graduates Information (2010)
Graduation Rate
School:
98.0%
District:
83.6%
State:
78.6%
Teacher Education Background (2009)
Percent With Master's Degree
School:
29.6%
District:
70.1%
Percent With Bachelor's Degree
School:
3.7%
District:
5.1%
Teacher Credentials & Experience (2009)
Percent of Teachers With Credentials: 100.0%
Number of Certificated Staff: 54.0
Average Number of Years of Teacher Experience: 9.8
Average Age
School:
37.7
District:
48.7
Source: CA Department of Education, Source: NCES 2009-2010
School Ratings and Reviews
Be The First To Review Orange County High School of the Arts!
Sponsored Links
Test Scores and Performance Information
Overall School Rating
How is this determined?
The overall school rating shows that Orange County High School of the Arts performed on average much better than most other schools across the state on CST state exams in the following subjects:
- CST Algebra I
- CST Algebra II
- CST Biology
- CST Chemistry
- CST English-Language Arts
- CST General Mathematics
- CST Geometry
- CST History - Social Science
- CST Integrated Math 2
- CST Integrated/Coordinated Science
- CST Mathematics
- CST Physics
- CST Science
- CST Summative High School Math
- CST U.S. History
- CST World History
AYP Results (2010)
Overall AYP Met: Yes
ELA AYP Met: Yes
Math AYP Met: Yes
ACT Exam Results (2009)
Percent of Students Taking ACT Exam: 43.1%
Average Combined Score: 24.6
Percent Scoring At or Above 21: 81.6%
SAT Exam Results (2009)
Percent of Students Taking SAT Exam: 62.4%
Average Combined Score: 1,706.0
Critical Reading Average: 573.7
Math Average: 559.3
Writing Average: 572.9
Percent Scoring At or Above 1500: 78.6%
CST - Test Proficiency by Grade and Subject
Grade 7 - % of students at or above proficiency
| School | District | State | |
|---|---|---|---|
| CST Algebra I Test | |||
| 2010 | 88.0% | - | 84.0% |
| 2009 | 81.0% | - | 81.0% |
| 2008 | 65.0% | 61.0% | 80.0% |
| CST English-Language Arts Test | |||
| 2010 | 93.0% | 37.0% | 55.0% |
| 2009 | 89.0% | 38.0% | 54.0% |
| 2008 | 85.0% | 34.0% | 49.0% |
| CST Mathematics Test | |||
| 2010 | 82.0% | 42.0% | 48.0% |
| 2009 | 57.0% | 36.0% | 43.0% |
| 2008 | 60.0% | 38.0% | 41.0% |
Grade 8 - % of students at or above proficiency
| School | District | State | |
|---|---|---|---|
| CST Algebra I Test | |||
| 2010 | 42.0% | 56.0% | 46.0% |
| 2009 | 28.0% | 48.0% | 44.0% |
| 2008 | 25.0% | 53.0% | 42.0% |
| CST English-Language Arts Test | |||
| 2010 | 89.0% | 38.0% | 54.0% |
| 2009 | 84.0% | 33.0% | 48.0% |
| 2008 | 84.0% | 31.0% | 45.0% |
| CST General Mathematics Test | |||
| 2010 | 56.0% | 19.0% | 30.0% |
| 2009 | 35.0% | 17.0% | 30.0% |
| 2008 | 45.0% | 23.0% | 31.0% |
| CST Geometry Test | |||
| 2010 | 89.0% | - | 85.0% |
| 2009 | 86.0% | - | 87.0% |
| 2008 | 63.0% | - | 84.0% |
| CST History - Social Science Test | |||
| 2010 | 72.0% | 33.0% | 47.0% |
| 2009 | 70.0% | 29.0% | 42.0% |
| 2008 | 64.0% | 25.0% | 36.0% |
| CST Science Test | |||
| 2010 | 81.0% | 44.0% | 59.0% |
| 2009 | 81.0% | 43.0% | 56.0% |
| 2008 | 81.0% | 45.0% | 52.0% |
Grade 9 - % of students at or above proficiency
| School | District | State | |
|---|---|---|---|
| CST Algebra I Test | |||
| 2010 | 42.0% | 18.0% | 22.0% |
| 2009 | 27.0% | 19.0% | 21.0% |
| 2008 | 14.0% | 11.0% | 18.0% |
| CST Algebra II Test | |||
| 2010 | 84.0% | - | 69.0% |
| 2009 | 66.0% | - | 65.0% |
| 2008 | 48.0% | 47.0% | 66.0% |
| CST Biology Test | |||
| 2010 | 87.0% | 59.0% | 55.0% |
| 2009 | 82.0% | 51.0% | 51.0% |
| 2008 | 72.0% | 53.0% | 52.0% |
| CST English-Language Arts Test | |||
| 2010 | 95.0% | 43.0% | 54.0% |
| 2009 | 93.0% | 35.0% | 50.0% |
| 2008 | 90.0% | 32.0% | 49.0% |
| CST Geometry Test | |||
| 2010 | 52.0% | 43.0% | 46.0% |
| 2009 | 58.0% | 39.0% | 47.0% |
| 2008 | 46.0% | 29.0% | 43.0% |
| CST Integrated Math 2 Test | |||
| 2010 | 57.0% | - | 36.0% |
| CST General Mathematics Test | |||
| 2008 | 25.0% | 4.0% | 18.0% |
Grade 10 - % of students at or above proficiency
| School | District | State | |
|---|---|---|---|
| CST Algebra II Test | |||
| 2010 | 39.0% | 41.0% | 40.0% |
| 2009 | 37.0% | 32.0% | 37.0% |
| 2008 | 29.0% | 21.0% | 36.0% |
| CST Biology Test | |||
| 2010 | 78.0% | 15.0% | 38.0% |
| 2009 | 74.0% | 12.0% | 34.0% |
| 2008 | 67.0% | 14.0% | 35.0% |
| CST Chemistry Test | |||
| 2010 | 59.0% | 38.0% | 47.0% |
| 2009 | 53.0% | 38.0% | 44.0% |
| 2008 | 51.0% | 31.0% | 41.0% |
| CST English-Language Arts Test | |||
| 2010 | 88.0% | 33.0% | 45.0% |
| 2009 | 84.0% | 30.0% | 44.0% |
| 2008 | 84.0% | 26.0% | 41.0% |
| CST Geometry Test | |||
| 2010 | 22.0% | 6.0% | 14.0% |
| 2009 | 22.0% | 5.0% | 14.0% |
| 2008 | 18.0% | 2.0% | 12.0% |
| CST Integrated Math 2 Test | |||
| 2010 | 76.0% | - | 41.0% |
| CST Science Test | |||
| 2010 | 88.0% | 29.0% | 46.0% |
| 2009 | 83.0% | 29.0% | 44.0% |
| 2008 | 83.0% | 26.0% | 40.0% |
| CST Summative High School Math Test | |||
| 2010 | 61.0% | - | 75.0% |
| 2009 | 55.0% | 35.0% | 71.0% |
| 2008 | 76.0% | 50.0% | 68.0% |
| CST World History Test | |||
| 2010 | 74.0% | 29.0% | 42.0% |
| 2009 | 77.0% | 27.0% | 38.0% |
| 2008 | 64.0% | 20.0% | 33.0% |
| CST Algebra I Test | |||
| 2009 | 8.0% | 6.0% | 11.0% |
| 2008 | 8.0% | 3.0% | 9.0% |
| CST Integrated/Coordinated Science Test | |||
| 2008 | 41.0% | - | 7.0% |
Grade 11 - % of students at or above proficiency
| School | District | State | |
|---|---|---|---|
| CST Algebra II Test | |||
| 2010 | 15.0% | 8.0% | 14.0% |
| 2009 | 14.0% | 5.0% | 12.0% |
| 2008 | 9.0% | 3.0% | 11.0% |
| CST Biology Test | |||
| 2010 | 94.0% | 23.0% | 46.0% |
| 2009 | - | - | - |
| 2008 | 84.0% | 16.0% | 39.0% |
| CST Chemistry Test | |||
| 2010 | 33.0% | 16.0% | 30.0% |
| 2009 | 47.0% | 14.0% | 27.0% |
| 2008 | 29.0% | 13.0% | 25.0% |
| CST English-Language Arts Test | |||
| 2010 | 84.0% | 30.0% | 42.0% |
| 2009 | 81.0% | 27.0% | 40.0% |
| 2008 | 82.0% | 23.0% | 37.0% |
| CST Geometry Test | |||
| 2010 | 5.0% | 1.0% | 6.0% |
| 2009 | 17.0% | 2.0% | 7.0% |
| CST Integrated/Coordinated Science Test | |||
| 2010 | 14.0% | - | 8.0% |
| CST Physics Test | |||
| 2010 | 81.0% | 52.0% | 53.0% |
| 2009 | 73.0% | 50.0% | 50.0% |
| 2008 | 75.0% | 42.0% | 47.0% |
| CST Summative High School Math Test | |||
| 2010 | 37.0% | 31.0% | 50.0% |
| 2009 | 41.0% | 21.0% | 47.0% |
| 2008 | 46.0% | 19.0% | 43.0% |
| CST U.S. History Test | |||
| 2010 | 79.0% | 35.0% | 45.0% |
| 2009 | 80.0% | 30.0% | 44.0% |
| 2008 | 72.0% | 26.0% | 38.0% |
End of Course - % of students at or above proficiency
| School | District | State | |
|---|---|---|---|
| CST Algebra I Test | |||
| 2010 | 48.0% | 29.0% | 31.0% |
| 2009 | 30.0% | 25.0% | 28.0% |
| 2008 | 25.0% | 23.0% | 25.0% |
| CST Algebra II Test | |||
| 2010 | 42.0% | 19.0% | 31.0% |
| 2009 | 36.0% | 16.0% | 28.0% |
| 2008 | 25.0% | 10.0% | 27.0% |
| CST Biology Test | |||
| 2010 | 87.0% | 26.0% | 46.0% |
| 2009 | 80.0% | 19.0% | 42.0% |
| 2008 | 72.0% | 21.0% | 42.0% |
| CST Chemistry Test | |||
| 2010 | 52.0% | 25.0% | 38.0% |
| 2009 | 50.0% | 24.0% | 36.0% |
| 2008 | 43.0% | 19.0% | 32.0% |
| CST General Mathematics Test | |||
| 2010 | 56.0% | 18.0% | 27.0% |
| 2009 | 33.0% | 16.0% | 26.0% |
| 2008 | 40.0% | 21.0% | 27.0% |
| CST Geometry Test | |||
| 2010 | 41.0% | 15.0% | 27.0% |
| 2009 | 49.0% | 12.0% | 26.0% |
| 2008 | 35.0% | 9.0% | 24.0% |
| CST Integrated Math 2 Test | |||
| 2010 | 62.0% | - | 27.0% |
| CST Integrated/Coordinated Science Test | |||
| 2010 | 23.0% | - | 16.0% |
| 2009 | - | - | - |
| 2008 | 32.0% | - | 11.0% |
| CST Physics Test | |||
| 2010 | 82.0% | 52.0% | 49.0% |
| 2009 | 73.0% | 50.0% | 46.0% |
| 2008 | 76.0% | 42.0% | 43.0% |
| CST Summative High School Math Test | |||
| 2010 | 43.0% | 31.0% | 54.0% |
| 2009 | 43.0% | 21.0% | 50.0% |
| 2008 | 54.0% | 21.0% | 47.0% |
| CST World History Test | |||
| 2010 | 74.0% | 28.0% | 41.0% |
| 2009 | 76.0% | 26.0% | 38.0% |
| 2008 | 64.0% | 19.0% | 33.0% |
Source: CA Department of Education 2009-2010
School Map and Similar Schools Nearby
Click to Activate Map of Nearby School Campuses
Private
Public
This School
Similar Schools Nearby
| Nova Academy 9-12 | 91 Students | 2.1 miles away | Not Yet Rated | |
Compare This School To Nearby Schools ->
School Community Forum

Join a discussion about Orange County High School of the Arts and talk to others in the community including students, parents, teachers, and administrators.
Popular Discussion Topics
- Admissions and Registration Questions (e.g. Dress Code and Discipline Policy)
- School Calendar and Upcoming Events (e.g. Graduation)
- After School Programs, Extracurricular Activities, and Athletics (e.g. Football)
- News and Announcements (e.g. Yearbook and Class Supply List Details)
- Graduate and Alumni Events (e.g. Organizing Class Reunions)
Navigation
Can't Find What You Are Looking For?
Rankings
Nearby Cities
Sponsored Links
K-12 Articles
Bullies... What Are They Good For?
Bullies have been around since the beginning of time. We had to deal with bullies, and our parents...
Those Pesky Little Transitions
Transitions are rarely easy, yet we have to encounter them every day of our lives. For school-aged...
Teacher Tenure: A Double-Edged Sword
Teacher Tenure (the policy making it almost impossible to fire teachers) has noble roots. It was...
