Santa Clara High School

No Reviews Yet
Find Old Friends From Santa Clara High School
Use the form below to search for alumni from Santa Clara High School.
School Description
School Summary and Highlights
- Enrolls 1,844 high school students from grades 9-12
- Ranks 504th out of 1,197 high schools in CA.
- 2010 Overall School AYP Met Status: No
Additional Contact Information
- Mailing Address: 3000 Benton St., Santa Clara, CA 95051
School District Details
- Santa Clara Unified School District
- Per-Pupil Spending: $9,564
- Graduation Rate: 81.6%
- Dropout Rate: 2.9%
- Students Per Teacher: 21.0
- Enrolled Students: 14,927
Faculty Details and Student Enrollment
Students and Faculty
- Total Students Enrolled: 1,844
- Total Full Time "Equivalent" Teachers: 75.4
- Average Student-To-Teacher Ratio: 24.5
Students Gender Breakdown
- Males: 879 (47.7%)
- Females: 965 (52.3%)
Free Lunch Student Eligibility Breakdown
- Eligible for Reduced Lunch: 216 (11.7%)
- Eligible for Free Lunch: 578 (31.3%)
- Eligible for Either Reduced or Free Lunch: 794 (43.1%)
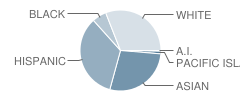
Student Enrollment Distribution by Race / Ethnicity

| Number | Percent | |
|---|---|---|
| American Indian | 7 | 0.4% |
| Black | 104 | 5.6% |
| Asian | 502 | 27.2% |
| Hispanic | 612 | 33.2% |
| White | 556 | 30.2% |
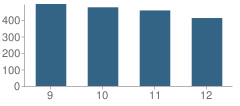
Number of Students Per Grade

| Number | Percent | |
|---|---|---|
| 9th Grade | 497 | 27.0% |
| 10th Grade | 477 | 25.9% |
| 11th Grade | 458 | 24.8% |
| 12th Grade | 412 | 22.3% |
Graduates Information (2010)
Graduation Rate
School:
95.2%
District:
88.0%
State:
78.6%
Teacher Education Background (2009)
Percent With Ph.D.
School:
2.2%
District:
2.6%
Percent With Master's Degree
School:
20.4%
District:
35.9%
Percent With Bachelor's Degree
School:
31.2%
District:
20.5%
Teacher Credentials & Experience (2009)
Percent of Teachers With Emergency Credentials: 2.4%
Percent of Teachers With Credentials: 91.6%
Number of Certificated Staff: 93.0
Average Number of Years of Teacher Experience: 8.6
Average Age
School:
38.7
District:
44.8
Source: CA Department of Education, Source: NCES 2009-2010
School Ratings and Reviews
Be The First To Review Santa Clara High School!
Sponsored Links
Test Scores and Performance Information
Overall School Rating
How is this determined?
The overall school rating shows that Santa Clara High School performed on average about the same as other schools across the state on CST state exams in the following subjects:
- CST Algebra I
- CST Algebra II
- CST Biology
- CST Chemistry
- CST Earth Science
- CST English-Language Arts
- CST General Mathematics
- CST Geometry
- CST Physics
- CST Science
- CST Summative High School Math
- CST U.S. History
- CST World History
AYP Results (2010)
Overall AYP Met: No
ELA AYP Met: No
Math AYP Met: No
ACT Exam Results (2009)
Percent of Students Taking ACT Exam: 10.1%
Average Combined Score: 21.6
Percent Scoring At or Above 21: 61.4%
SAT Exam Results (2009)
Percent of Students Taking SAT Exam: 45.6%
Average Combined Score: 1,506.1
Critical Reading Average: 486.5
Math Average: 528.2
Writing Average: 491.4
Percent Scoring At or Above 1500: 50.8%
CST - Test Proficiency by Grade and Subject
Grade 9 - % of students at or above proficiency
| School | District | State | |
|---|---|---|---|
| CST Algebra I Test | |||
| 2010 | 14.0% | 13.0% | 22.0% |
| 2009 | 14.0% | 9.0% | 21.0% |
| 2008 | 12.0% | 11.0% | 18.0% |
| CST Algebra II Test | |||
| 2010 | 87.0% | 76.0% | 69.0% |
| 2009 | 60.0% | 74.0% | 65.0% |
| 2008 | 67.0% | 71.0% | 66.0% |
| CST Biology Test | |||
| 2010 | 66.0% | 53.0% | 55.0% |
| 2009 | 65.0% | 54.0% | 51.0% |
| 2008 | 67.0% | 59.0% | 52.0% |
| CST Earth Science Test | |||
| 2010 | 26.0% | 24.0% | 35.0% |
| 2009 | 27.0% | 21.0% | 29.0% |
| 2008 | 32.0% | 26.0% | 31.0% |
| CST English-Language Arts Test | |||
| 2010 | 56.0% | 61.0% | 54.0% |
| 2009 | 53.0% | 52.0% | 50.0% |
| 2008 | 53.0% | 52.0% | 49.0% |
| CST General Mathematics Test | |||
| 2010 | 14.0% | 13.0% | 17.0% |
| 2009 | 5.0% | 5.0% | 17.0% |
| 2008 | 12.0% | 11.0% | 18.0% |
| CST Geometry Test | |||
| 2010 | 51.0% | 47.0% | 46.0% |
| 2009 | 55.0% | 47.0% | 47.0% |
| 2008 | 63.0% | 44.0% | 43.0% |
Grade 10 - % of students at or above proficiency
| School | District | State | |
|---|---|---|---|
| CST Algebra I Test | |||
| 2010 | 13.0% | 8.0% | 12.0% |
| 2009 | 5.0% | 4.0% | 11.0% |
| 2008 | 7.0% | 5.0% | 9.0% |
| CST Algebra II Test | |||
| 2010 | 53.0% | 40.0% | 40.0% |
| 2009 | 38.0% | 28.0% | 37.0% |
| 2008 | 41.0% | 32.0% | 36.0% |
| CST Biology Test | |||
| 2010 | 37.0% | 29.0% | 38.0% |
| 2009 | 27.0% | 18.0% | 34.0% |
| 2008 | 26.0% | 26.0% | 35.0% |
| CST Chemistry Test | |||
| 2010 | 31.0% | 34.0% | 47.0% |
| 2009 | 27.0% | 29.0% | 44.0% |
| 2008 | 19.0% | 24.0% | 41.0% |
| CST English-Language Arts Test | |||
| 2010 | 49.0% | 47.0% | 45.0% |
| 2009 | 41.0% | 42.0% | 44.0% |
| 2008 | 42.0% | 41.0% | 41.0% |
| CST Geometry Test | |||
| 2010 | 9.0% | 6.0% | 14.0% |
| 2009 | 10.0% | 7.0% | 14.0% |
| 2008 | 17.0% | 12.0% | 12.0% |
| CST Science Test | |||
| 2010 | 55.0% | 50.0% | 46.0% |
| 2009 | 44.0% | 42.0% | 44.0% |
| 2008 | 41.0% | 40.0% | 40.0% |
| CST Summative High School Math Test | |||
| 2010 | 64.0% | 83.0% | 75.0% |
| 2009 | 72.0% | 71.0% | 71.0% |
| CST World History Test | |||
| 2010 | 57.0% | 48.0% | 42.0% |
| 2009 | 48.0% | 46.0% | 38.0% |
| 2008 | 37.0% | 37.0% | 33.0% |
| CST Earth Science Test | |||
| 2009 | 4.0% | 3.0% | 23.0% |
Grade 11 - % of students at or above proficiency
| School | District | State | |
|---|---|---|---|
| CST Algebra I Test | |||
| 2010 | 13.0% | 10.0% | 8.0% |
| 2009 | 14.0% | 9.0% | 8.0% |
| 2008 | 18.0% | 10.0% | 5.0% |
| CST Algebra II Test | |||
| 2010 | 12.0% | 8.0% | 14.0% |
| 2009 | 13.0% | 10.0% | 12.0% |
| 2008 | 18.0% | 13.0% | 11.0% |
| CST Biology Test | |||
| 2010 | 46.0% | 51.0% | 46.0% |
| 2009 | 27.0% | 40.0% | 41.0% |
| 2008 | 35.0% | 39.0% | 39.0% |
| CST Chemistry Test | |||
| 2010 | 13.0% | 17.0% | 30.0% |
| 2009 | 7.0% | 10.0% | 27.0% |
| 2008 | 12.0% | 11.0% | 25.0% |
| CST English-Language Arts Test | |||
| 2010 | 44.0% | 44.0% | 42.0% |
| 2009 | 41.0% | 40.0% | 40.0% |
| 2008 | 42.0% | 38.0% | 37.0% |
| CST Geometry Test | |||
| 2010 | 3.0% | 3.0% | 6.0% |
| 2009 | 7.0% | 5.0% | 7.0% |
| 2008 | 4.0% | 4.0% | 6.0% |
| CST Physics Test | |||
| 2010 | 66.0% | 65.0% | 53.0% |
| 2009 | 63.0% | 62.0% | 50.0% |
| 2008 | 62.0% | 63.0% | 47.0% |
| CST Summative High School Math Test | |||
| 2010 | 53.0% | 49.0% | 50.0% |
| 2009 | 51.0% | 45.0% | 47.0% |
| 2008 | 49.0% | 45.0% | 43.0% |
| CST U.S. History Test | |||
| 2010 | 54.0% | 49.0% | 45.0% |
| 2009 | 48.0% | 46.0% | 44.0% |
| 2008 | 49.0% | 44.0% | 38.0% |
| CST World History Test | |||
| 2009 | 10.0% | 23.0% | 11.0% |
| 2008 | 10.0% | 14.0% | 9.0% |
| CST Earth Science Test | |||
| 2008 | 9.0% | 7.0% | 28.0% |
End of Course - % of students at or above proficiency
| School | District | State | |
|---|---|---|---|
| CST Algebra I Test | |||
| 2010 | 14.0% | 32.0% | 31.0% |
| 2009 | 11.0% | 29.0% | 28.0% |
| 2008 | 11.0% | 27.0% | 25.0% |
| CST Algebra II Test | |||
| 2010 | 37.0% | 30.0% | 31.0% |
| 2009 | 26.0% | 23.0% | 28.0% |
| 2008 | 31.0% | 26.0% | 27.0% |
| CST Biology Test | |||
| 2010 | 52.0% | 46.0% | 46.0% |
| 2009 | 43.0% | 38.0% | 42.0% |
| 2008 | 44.0% | 44.0% | 42.0% |
| CST Chemistry Test | |||
| 2010 | 24.0% | 29.0% | 38.0% |
| 2009 | 20.0% | 22.0% | 36.0% |
| 2008 | 16.0% | 18.0% | 32.0% |
| CST Earth Science Test | |||
| 2010 | 25.0% | 23.0% | 33.0% |
| 2009 | 24.0% | 18.0% | 28.0% |
| 2008 | 28.0% | 22.0% | 28.0% |
| CST General Mathematics Test | |||
| 2010 | 14.0% | 28.0% | 27.0% |
| 2009 | 5.0% | 24.0% | 26.0% |
| 2008 | 12.0% | 19.0% | 27.0% |
| CST Geometry Test | |||
| 2010 | 22.0% | 26.0% | 27.0% |
| 2009 | 26.0% | 27.0% | 26.0% |
| 2008 | 29.0% | 27.0% | 24.0% |
| CST Physics Test | |||
| 2010 | 67.0% | 65.0% | 49.0% |
| 2009 | 63.0% | 62.0% | 46.0% |
| 2008 | 62.0% | 62.0% | 43.0% |
| CST Summative High School Math Test | |||
| 2010 | 54.0% | 55.0% | 54.0% |
| 2009 | 56.0% | 50.0% | 50.0% |
| 2008 | 53.0% | 51.0% | 47.0% |
| CST World History Test | |||
| 2010 | 54.0% | 47.0% | 41.0% |
| 2009 | 47.0% | 45.0% | 38.0% |
| 2008 | 37.0% | 36.0% | 33.0% |
Source: CA Department of Education 2009-2010
School Map and Similar Schools Nearby
Click to Activate Map of Nearby School Campuses
Private
Public
This School
Similar Schools Nearby
| Adrian Wilcox High School 9-12 | 1,903 Students | 1.4 miles away | Not Yet Rated | |
| Cupertino High School 9-12 | 1,708 Students | 2.3 miles away | Not Yet Rated | |
| Lynbrook High School 9-12 | 1,837 Students | 3.4 miles away | Not Yet Rated | |
| Abraham Lincoln High School 9-12 | 1,698 Students | 3.5 miles away | ![]() 5 out of 5 | |
| Middle College High School 10-12 | 40 Students | 3.6 miles away | Not Yet Rated | |
| Prospect High School 9-12 | 1,412 Students | 3.9 miles away | Not Yet Rated | |
| Del Mar High School 9-12 | 1,282 Students | 4.2 miles away | ![]() 4 out of 5 | |
| Homestead High School 9-12 | 2,249 Students | 4.3 miles away | Not Yet Rated | |
| Monta Vista High School 9-12 | 2,529 Students | 4.6 miles away | Not Yet Rated | |
| Westmont High School 9-12 | 1,688 Students | 5.3 miles away | Not Yet Rated | |
Compare This School To Nearby Schools ->
School Community Forum

Join a discussion about Santa Clara High School and talk to others in the community including students, parents, teachers, and administrators.
Popular Discussion Topics
- Admissions and Registration Questions (e.g. Dress Code and Discipline Policy)
- School Calendar and Upcoming Events (e.g. Graduation)
- After School Programs, Extracurricular Activities, and Athletics (e.g. Football)
- News and Announcements (e.g. Yearbook and Class Supply List Details)
- Graduate and Alumni Events (e.g. Organizing Class Reunions)
Navigation
Can't Find What You Are Looking For?
Rankings
Nearby Cities
Sponsored Links
K-12 Articles
Information on Cyberbullying
What is Cyberbullying? Cyberbullying is a new form of harassment, emotional abuse,...
Homework Tips: Taking the Work out of Homework
Kids hate homework. It seems that almost every night of the week they are overloaded with...
Attend Your Teen's Holiday Parties
Christmas and New Years are coming, and with them Christmas and New Years Eve parties. At many of...


