Montgomery High School

No Reviews Yet
Find Old Friends From Montgomery High School
Use the form below to search for alumni from Montgomery High School.
School Description
School Summary and Highlights
- Enrolls 1,755 high school students from grades 9-12
- Ranks 258th out of 1,197 high schools in CA.
Additional Contact Information
- Mailing Address: 1250 Hahman Dr., Santa Rosa, CA 95405
School Operational Details
- Title I Eligible
Faculty Details and Student Enrollment
Students and Faculty
- Total Students Enrolled: 1,755
- Total Full Time "Equivalent" Teachers: 92.0
- Average Student-To-Teacher Ratio: 19.1
Students Gender Breakdown
- Males: 887 (50.5%)
- Females: 868 (49.5%)
Free Lunch Student Eligibility Breakdown
- Eligible for Reduced Lunch: 95 (5.4%)
- Eligible for Free Lunch: 331 (18.9%)
- Eligible for Either Reduced or Free Lunch: 426 (24.3%)
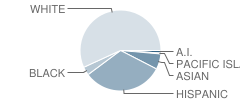
Student Enrollment Distribution by Race / Ethnicity

| Number | Percent | |
|---|---|---|
| American Indian | 19 | 1.1% |
| Black | 58 | 3.3% |
| Asian | 105 | 6.0% |
| Hispanic | 536 | 30.5% |
| White | 942 | 53.7% |
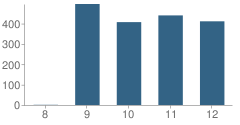
Number of Students Per Grade

| Number | Percent | |
|---|---|---|
| 8th Grade | 1 | 0.06% |
| 9th Grade | 496 | 28.3% |
| 10th Grade | 407 | 23.2% |
| 11th Grade | 440 | 25.1% |
| 12th Grade | 411 | 23.4% |
Teacher Education Background (2009)
Percent With Ph.D.: 90.1%
Percent With Master's Degree
School:
6.3%
District:
25.0%
Percent With Bachelor's Degree
School:
5.4%
District:
25.0%
Teacher Credentials & Experience (2009)
Percent of Teachers With Emergency Credentials: 1.1%
Percent of Teachers With Credentials: 98.9%
Number of Certificated Staff: 111.0
Average Number of Years of Teacher Experience: 15.2
Average Age
School:
45.9
District:
50.3
Source: CA Department of Education, Source: NCES 2009-2010
School Ratings and Reviews
Be The First To Review Montgomery High School!
Sponsored Links
Test Scores and Performance Information
Overall School Rating
How is this determined?
The overall school rating shows that Montgomery High School performed on average better than many other schools across the state on CST state exams in the following subjects:
- CST Algebra I
- CST Algebra II
- CST Biology
- CST Chemistry
- CST Earth Science
- CST English-Language Arts
- CST General Mathematics
- CST Geometry
- CST Physics
- CST Science
- CST Summative High School Math
- CST U.S. History
- CST World History
CST - Test Proficiency by Grade and Subject
Grade 9 - % of students at or above proficiency
| School | District | State | |
|---|---|---|---|
| CST Algebra I Test | |||
| 2010 | 38.0% | 27.0% | 22.0% |
| 2009 | 30.0% | 31.0% | 21.0% |
| 2008 | 42.0% | 31.0% | 18.0% |
| CST Biology Test | |||
| 2010 | 27.0% | 68.0% | 55.0% |
| CST Earth Science Test | |||
| 2010 | 49.0% | 41.0% | 35.0% |
| 2009 | 44.0% | 38.0% | 29.0% |
| 2008 | 56.0% | 43.0% | 31.0% |
| CST English-Language Arts Test | |||
| 2010 | 62.0% | 58.0% | 54.0% |
| 2009 | 55.0% | 55.0% | 50.0% |
| 2008 | 60.0% | 53.0% | 49.0% |
| CST General Mathematics Test | |||
| 2010 | 16.0% | 22.0% | 17.0% |
| 2009 | 6.0% | 17.0% | 17.0% |
| 2008 | 19.0% | 18.0% | 18.0% |
| CST Geometry Test | |||
| 2010 | 82.0% | 64.0% | 46.0% |
| 2009 | 85.0% | 68.0% | 47.0% |
| 2008 | 78.0% | 69.0% | 43.0% |
| CST World History Test | |||
| 2010 | 24.0% | 18.0% | 45.0% |
Grade 10 - % of students at or above proficiency
| School | District | State | |
|---|---|---|---|
| CST Algebra I Test | |||
| 2010 | 20.0% | 19.0% | 12.0% |
| 2009 | 12.0% | 11.0% | 11.0% |
| 2008 | 6.0% | 11.0% | 9.0% |
| CST Algebra II Test | |||
| 2010 | 69.0% | 55.0% | 40.0% |
| 2009 | 74.0% | 51.0% | 37.0% |
| 2008 | 71.0% | 51.0% | 36.0% |
| CST Biology Test | |||
| 2010 | 44.0% | 50.0% | 38.0% |
| 2009 | 45.0% | 45.0% | 34.0% |
| 2008 | 46.0% | 50.0% | 35.0% |
| CST Chemistry Test | |||
| 2010 | 100.0% | 78.0% | 47.0% |
| 2009 | 81.0% | 65.0% | 44.0% |
| 2008 | 86.0% | 77.0% | 41.0% |
| CST English-Language Arts Test | |||
| 2010 | 56.0% | 54.0% | 45.0% |
| 2009 | 54.0% | 46.0% | 44.0% |
| 2008 | 48.0% | 46.0% | 41.0% |
| CST Geometry Test | |||
| 2010 | 32.0% | 27.0% | 14.0% |
| 2009 | 36.0% | 27.0% | 14.0% |
| 2008 | 21.0% | 21.0% | 12.0% |
| CST Science Test | |||
| 2010 | 57.0% | 56.0% | 46.0% |
| 2009 | 51.0% | 47.0% | 44.0% |
| 2008 | 44.0% | 46.0% | 40.0% |
| CST World History Test | |||
| 2010 | 49.0% | 48.0% | 42.0% |
| 2009 | 51.0% | 41.0% | 38.0% |
| 2008 | 46.0% | 40.0% | 33.0% |
| CST Earth Science Test | |||
| 2008 | 12.0% | 20.0% | 23.0% |
Grade 11 - % of students at or above proficiency
| School | District | State | |
|---|---|---|---|
| CST Algebra I Test | |||
| 2010 | 4.0% | 7.0% | 8.0% |
| 2009 | 12.0% | 9.0% | 8.0% |
| 2008 | 4.0% | 5.0% | 5.0% |
| CST Algebra II Test | |||
| 2010 | 20.0% | 20.0% | 14.0% |
| 2009 | 11.0% | 11.0% | 12.0% |
| 2008 | 26.0% | 17.0% | 11.0% |
| CST Biology Test | |||
| 2010 | 55.0% | 36.0% | 46.0% |
| 2009 | 53.0% | 36.0% | 41.0% |
| 2008 | 34.0% | 29.0% | 39.0% |
| CST Chemistry Test | |||
| 2010 | 67.0% | 54.0% | 30.0% |
| 2009 | 62.0% | 46.0% | 27.0% |
| 2008 | 54.0% | 47.0% | 25.0% |
| CST Earth Science Test | |||
| 2010 | 20.0% | 26.0% | 32.0% |
| 2009 | - | - | - |
| 2008 | 16.0% | 31.0% | 28.0% |
| CST English-Language Arts Test | |||
| 2010 | 54.0% | 47.0% | 42.0% |
| 2009 | 52.0% | 46.0% | 40.0% |
| 2008 | 47.0% | 43.0% | 37.0% |
| CST Geometry Test | |||
| 2010 | 3.0% | 4.0% | 6.0% |
| 2009 | 7.0% | 12.0% | 7.0% |
| CST Summative High School Math Test | |||
| 2010 | 80.0% | 70.0% | 50.0% |
| 2009 | 79.0% | 66.0% | 47.0% |
| 2008 | 72.0% | 64.0% | 43.0% |
| CST U.S. History Test | |||
| 2010 | 51.0% | 42.0% | 45.0% |
| 2009 | 50.0% | 43.0% | 44.0% |
| 2008 | 42.0% | 37.0% | 38.0% |
| CST World History Test | |||
| 2010 | 13.0% | 13.0% | 15.0% |
| 2009 | - | - | - |
| 2008 | 11.0% | 15.0% | 9.0% |
| CST Physics Test | |||
| 2008 | 65.0% | 63.0% | 47.0% |
End of Course - % of students at or above proficiency
| School | District | State | |
|---|---|---|---|
| CST Algebra I Test | |||
| 2010 | 31.0% | 33.0% | 31.0% |
| 2009 | 24.0% | 30.0% | 28.0% |
| 2008 | 26.0% | 29.0% | 25.0% |
| CST Algebra II Test | |||
| 2010 | 35.0% | 37.0% | 31.0% |
| 2009 | 35.0% | 32.0% | 28.0% |
| 2008 | 45.0% | 34.0% | 27.0% |
| CST Biology Test | |||
| 2010 | 45.0% | 51.0% | 46.0% |
| 2009 | 46.0% | 49.0% | 42.0% |
| 2008 | 44.0% | 49.0% | 42.0% |
| CST Chemistry Test | |||
| 2010 | 70.0% | 60.0% | 38.0% |
| 2009 | 66.0% | 50.0% | 36.0% |
| 2008 | 62.0% | 54.0% | 32.0% |
| CST Earth Science Test | |||
| 2010 | 48.0% | 39.0% | 33.0% |
| 2009 | 41.0% | 36.0% | 28.0% |
| 2008 | 52.0% | 39.0% | 28.0% |
| CST General Mathematics Test | |||
| 2010 | 16.0% | 41.0% | 27.0% |
| 2009 | 6.0% | 36.0% | 26.0% |
| 2008 | 19.0% | 37.0% | 27.0% |
| CST Geometry Test | |||
| 2010 | 44.0% | 36.0% | 27.0% |
| 2009 | 42.0% | 37.0% | 26.0% |
| 2008 | 34.0% | 33.0% | 24.0% |
| CST Summative High School Math Test | |||
| 2010 | 79.0% | 72.0% | 54.0% |
| 2009 | 79.0% | 66.0% | 50.0% |
| 2008 | 73.0% | 65.0% | 47.0% |
| CST World History Test | |||
| 2010 | 46.0% | 42.0% | 41.0% |
| 2009 | 49.0% | 39.0% | 38.0% |
| 2008 | 43.0% | 38.0% | 33.0% |
| CST Physics Test | |||
| 2008 | 65.0% | 63.0% | 43.0% |
Source: CA Department of Education 2009-2010
School Map and Similar Schools Nearby
Click to Activate Map of Nearby School Campuses
Private
Public
This School
Similar Schools Nearby
| Santa Rosa High School 9-12 | 1,942 Students | 2.0 miles away | Not Yet Rated | |
| Maria Carrillo High School 9-12 | 1,574 Students | 3.0 miles away | ![]() 4.5 out of 5 | |
| Elsie Allen High School 9-12 | 1,151 Students | 3.8 miles away | ![]() 5 out of 5 | |
| Piner High School 9-12 | 1,178 Students | 4.8 miles away | ![]() 1 out of 5 | |
| Analy High School 9-12 | 1,280 Students | 8.0 miles away | ![]() 5 out of 5 | |
| Windsor High School 9-12 | 1,673 Students | 10.1 miles away | Not Yet Rated | |
| El Molino High School 9-12 | 852 Students | 11.5 miles away | ![]() 4.5 out of 5 | |
| Healdsburg Junior High School 6-8 | 446 Students | 15.7 miles away | Not Yet Rated | |
| Healdsburg High School 9-12 | 805 Students | 16.0 miles away | Not Yet Rated | |
| Sonoma Valley High School 9-12 | 1,314 Students | 16.3 miles away | Not Yet Rated | |
Compare This School To Nearby Schools ->
School Community Forum

Join a discussion about Montgomery High School and talk to others in the community including students, parents, teachers, and administrators.
Popular Discussion Topics
- Admissions and Registration Questions (e.g. Dress Code and Discipline Policy)
- School Calendar and Upcoming Events (e.g. Graduation)
- After School Programs, Extracurricular Activities, and Athletics (e.g. Football)
- News and Announcements (e.g. Yearbook and Class Supply List Details)
- Graduate and Alumni Events (e.g. Organizing Class Reunions)
Navigation
Can't Find What You Are Looking For?
Rankings
Nearby Cities
Sponsored Links
K-12 Articles
Keep Your Licensed Teen Safe This Summer
Every year hundreds of teenage drivers lose their lives in motor vehicle accidents. Statistics show...
Beating the Summer Slump
"The Summer Slump", teachers call it. It happens every year. It makes its way into lesson plans...
Keep Morning Stress at a Minimum: Establish a Routine
Morning! It can be a time of stress. The kids are fighting over who gets to use the bathroom first,...


