Santa Ynez Valley Union High School

No Reviews Yet
Find Old Friends From Santa Ynez Valley Union High School
Use the form below to search for alumni from Santa Ynez Valley Union High School.
School Description
School Summary and Highlights
- Enrolls 1,080 high school students from grades 9-12
- Ranks 177th out of 1,197 high schools in CA.
- 2010 Overall School AYP Met Status: No
Additional Contact Information
- Mailing Address: PO Box 398, Santa Ynez, CA 93460
School Operational Details
- Title I Eligible
School District Details
- Santa Ynez Valley Union High School District
- Per-Pupil Spending: $10,988
- Dropout Rate: 0.8%
- Students Per Teacher: 22.9
- Enrolled Students: 1,114
Faculty Details and Student Enrollment
Students and Faculty
- Total Students Enrolled: 1,080
- Total Full Time "Equivalent" Teachers: 47.8
- Average Student-To-Teacher Ratio: 22.6
Students Gender Breakdown
- Males: 540 (50.0%)
- Females: 540 (50.0%)
Free Lunch Student Eligibility Breakdown
- Eligible for Reduced Lunch: 43 (4.0%)
- Eligible for Free Lunch: 207 (19.2%)
- Eligible for Either Reduced or Free Lunch: 250 (23.1%)
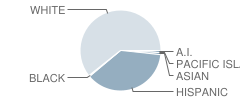
Student Enrollment Distribution by Race / Ethnicity

| Number | Percent | |
|---|---|---|
| American Indian | 8 | 0.7% |
| Black | 5 | 0.5% |
| Asian | 9 | 0.8% |
| Hispanic | 385 | 35.6% |
| White | 627 | 58.1% |
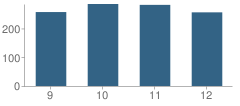
Number of Students Per Grade

| Number | Percent | |
|---|---|---|
| 9th Grade | 257 | 23.8% |
| 10th Grade | 285 | 26.4% |
| 11th Grade | 282 | 26.1% |
| 12th Grade | 256 | 23.7% |
Graduates Information (2010)
Graduation Rate
School:
98.0%
District:
96.3%
State:
78.6%
Teacher Education Background (2009)
Percent With Ph.D.: 1.7%
Percent With Master's Degree: 25.4%
Teacher Credentials & Experience (2009)
Percent of Teachers With Credentials: 100.0%
Number of Certificated Staff: 59.0
Average Number of Years of Teacher Experience: 15.6
Average Age
School:
45.1
District:
39.0
Source: CA Department of Education, Source: NCES 2009-2010
School Ratings and Reviews
Be The First To Review Santa Ynez Valley Union High School!
Sponsored Links
Test Scores and Performance Information
Overall School Rating
How is this determined?
The overall school rating shows that Santa Ynez Valley Union High School performed on average better than many other schools across the state on CST state exams in the following subjects:
- CST Algebra I
- CST Algebra II
- CST Biology
- CST Chemistry
- CST English-Language Arts
- CST General Mathematics
- CST Geometry
- CST Integrated Math 1
- CST Integrated/Coordinated Science
- CST Physics
- CST Science
- CST Summative High School Math
- CST U.S. History
- CST World History
AYP Results (2010)
Overall AYP Met: No
ELA AYP Met: Yes
Math AYP Met: No
ACT Exam Results (2009)
Percent of Students Taking ACT Exam: 12.6%
Average Combined Score: 23.8
Percent Scoring At or Above 21: 67.7%
SAT Exam Results (2009)
Percent of Students Taking SAT Exam: 48.3%
Average Combined Score: 1,587.6
Critical Reading Average: 525.7
Math Average: 536.3
Writing Average: 525.5
Percent Scoring At or Above 1500: 62.6%
CST - Test Proficiency by Grade and Subject
Grade 9 - % of students at or above proficiency
| School | District | State | |
|---|---|---|---|
| CST Algebra I Test | |||
| 2010 | 54.0% | 54.0% | 22.0% |
| 2009 | 34.0% | 34.0% | 21.0% |
| 2008 | 34.0% | 34.0% | 18.0% |
| CST Algebra II Test | |||
| 2010 | 71.0% | 71.0% | 69.0% |
| 2009 | 71.0% | 71.0% | 65.0% |
| 2008 | 74.0% | 74.0% | 66.0% |
| CST Biology Test | |||
| 2010 | 61.0% | 61.0% | 55.0% |
| CST Chemistry Test | |||
| 2010 | 48.0% | 48.0% | 49.0% |
| CST English-Language Arts Test | |||
| 2010 | 79.0% | 79.0% | 54.0% |
| 2009 | 74.0% | 73.0% | 50.0% |
| 2008 | 72.0% | 72.0% | 49.0% |
| CST General Mathematics Test | |||
| 2010 | 34.0% | 34.0% | 17.0% |
| 2009 | 47.0% | 47.0% | 17.0% |
| 2008 | 32.0% | 32.0% | 18.0% |
| CST Geometry Test | |||
| 2010 | 40.0% | 40.0% | 46.0% |
| 2009 | 54.0% | 54.0% | 47.0% |
| 2008 | 36.0% | 36.0% | 43.0% |
| CST Integrated/Coordinated Science Test | |||
| 2010 | 42.0% | 42.0% | 19.0% |
| 2009 | 38.0% | 38.0% | 15.0% |
| 2008 | 30.0% | 30.0% | 5.0% |
| CST Physics Test | |||
| 2009 | 79.0% | 79.0% | 35.0% |
| 2008 | 73.0% | 73.0% | 30.0% |
Grade 10 - % of students at or above proficiency
| School | District | State | |
|---|---|---|---|
| CST Algebra I Test | |||
| 2010 | 20.0% | 20.0% | 12.0% |
| 2009 | 15.0% | 14.0% | 11.0% |
| 2008 | 7.0% | 6.0% | 9.0% |
| CST Algebra II Test | |||
| 2010 | 55.0% | 55.0% | 40.0% |
| 2009 | 30.0% | 29.0% | 37.0% |
| 2008 | 50.0% | 50.0% | 36.0% |
| CST Biology Test | |||
| 2010 | 73.0% | 71.0% | 38.0% |
| 2009 | 55.0% | 54.0% | 34.0% |
| 2008 | 43.0% | 43.0% | 35.0% |
| CST English-Language Arts Test | |||
| 2010 | 71.0% | 70.0% | 45.0% |
| 2009 | 70.0% | 68.0% | 44.0% |
| 2008 | 59.0% | 58.0% | 41.0% |
| CST Geometry Test | |||
| 2010 | 11.0% | 11.0% | 14.0% |
| 2009 | 19.0% | 19.0% | 14.0% |
| 2008 | 11.0% | 11.0% | 12.0% |
| CST Science Test | |||
| 2010 | 76.0% | 74.0% | 46.0% |
| 2009 | 59.0% | 57.0% | 44.0% |
| 2008 | 61.0% | 59.0% | 40.0% |
| CST Summative High School Math Test | |||
| 2010 | 86.0% | 86.0% | 75.0% |
| 2009 | 74.0% | 74.0% | 71.0% |
| 2008 | 64.0% | 64.0% | 68.0% |
| CST World History Test | |||
| 2010 | 73.0% | 71.0% | 42.0% |
| 2009 | 59.0% | 58.0% | 38.0% |
| 2008 | 62.0% | 60.0% | 33.0% |
| CST Chemistry Test | |||
| 2009 | 42.0% | 42.0% | 44.0% |
| 2008 | 44.0% | 44.0% | 41.0% |
Grade 11 - % of students at or above proficiency
| School | District | State | |
|---|---|---|---|
| CST Algebra II Test | |||
| 2010 | 19.0% | 20.0% | 14.0% |
| 2009 | 8.0% | 8.0% | 12.0% |
| 2008 | 19.0% | 19.0% | 11.0% |
| CST Biology Test | |||
| 2010 | 76.0% | 70.0% | 46.0% |
| 2009 | 82.0% | 64.0% | 41.0% |
| 2008 | 96.0% | 89.0% | 39.0% |
| CST Chemistry Test | |||
| 2010 | 19.0% | 19.0% | 30.0% |
| 2009 | 15.0% | 15.0% | 27.0% |
| 2008 | 21.0% | 21.0% | 25.0% |
| CST English-Language Arts Test | |||
| 2010 | 61.0% | 58.0% | 42.0% |
| 2009 | 59.0% | 56.0% | 40.0% |
| 2008 | 54.0% | 50.0% | 37.0% |
| CST Geometry Test | |||
| 2010 | 4.0% | 4.0% | 6.0% |
| 2009 | 6.0% | 6.0% | 7.0% |
| 2008 | 2.0% | 2.0% | 6.0% |
| CST Integrated/Coordinated Science Test | |||
| 2010 | 37.0% | 35.0% | 8.0% |
| 2009 | 40.0% | 38.0% | 11.0% |
| 2008 | 34.0% | 33.0% | 10.0% |
| CST Summative High School Math Test | |||
| 2010 | 46.0% | 46.0% | 50.0% |
| 2009 | 50.0% | 50.0% | 47.0% |
| 2008 | 46.0% | 46.0% | 43.0% |
| CST U.S. History Test | |||
| 2010 | 65.0% | 61.0% | 45.0% |
| 2009 | 67.0% | 62.0% | 44.0% |
| 2008 | 49.0% | 45.0% | 38.0% |
| CST Integrated Math 1 Test | |||
| 2009 | 4.0% | 3.0% | 9.0% |
| CST Physics Test | |||
| 2009 | 74.0% | 74.0% | 50.0% |
End of Course - % of students at or above proficiency
| School | District | State | |
|---|---|---|---|
| CST Algebra I Test | |||
| 2010 | 40.0% | 38.0% | 31.0% |
| 2009 | 23.0% | 21.0% | 28.0% |
| 2008 | 18.0% | 17.0% | 25.0% |
| CST Algebra II Test | |||
| 2010 | 48.0% | 48.0% | 31.0% |
| 2009 | 35.0% | 35.0% | 28.0% |
| 2008 | 45.0% | 45.0% | 27.0% |
| CST Biology Test | |||
| 2010 | 72.0% | 70.0% | 46.0% |
| 2009 | 58.0% | 55.0% | 42.0% |
| 2008 | 56.0% | 54.0% | 42.0% |
| CST Chemistry Test | |||
| 2010 | 30.0% | 30.0% | 38.0% |
| 2009 | 32.0% | 32.0% | 36.0% |
| 2008 | 36.0% | 36.0% | 32.0% |
| CST General Mathematics Test | |||
| 2010 | 34.0% | 34.0% | 27.0% |
| 2009 | 47.0% | 47.0% | 26.0% |
| 2008 | 32.0% | 32.0% | 27.0% |
| CST Geometry Test | |||
| 2010 | 19.0% | 19.0% | 27.0% |
| 2009 | 35.0% | 34.0% | 26.0% |
| 2008 | 20.0% | 20.0% | 24.0% |
| CST Integrated/Coordinated Science Test | |||
| 2010 | 40.0% | 40.0% | 16.0% |
| 2009 | 39.0% | 38.0% | 13.0% |
| 2008 | 32.0% | 31.0% | 11.0% |
| CST Summative High School Math Test | |||
| 2010 | 58.0% | 58.0% | 54.0% |
| 2009 | 57.0% | 57.0% | 50.0% |
| 2008 | 50.0% | 50.0% | 47.0% |
| CST World History Test | |||
| 2010 | 71.0% | 69.0% | 41.0% |
| 2009 | 59.0% | 58.0% | 38.0% |
| 2008 | 59.0% | 57.0% | 33.0% |
| CST Integrated Math 1 Test | |||
| 2009 | 3.0% | 3.0% | 11.0% |
| CST Physics Test | |||
| 2009 | 77.0% | 77.0% | 46.0% |
| 2008 | 73.0% | 73.0% | 43.0% |
Source: CA Department of Education 2009-2010
School Map and Similar Schools Nearby
Click to Activate Map of Nearby School Campuses
Private
Public
This School
Similar Schools Nearby
| Dos Pueblos High School 9-12 | 2,389 Students | 17.0 miles away | Not Yet Rated | |
| Goleta Valley Junior High School 7-8 | 856 Students | 18.5 miles away | Not Yet Rated | |
| Lompoc High School 9-12 | 1,436 Students | 21.0 miles away | ![]() 5 out of 5 | |
| San Marcos High School 9-12 | 1,828 Students | 21.2 miles away | Not Yet Rated | |
| La Colina Junior High School 7-8 | 959 Students | 22.3 miles away | ![]() 5 out of 5 | |
| Cabrillo High School 9-12 | 1,508 Students | 22.6 miles away | ![]() 4.5 out of 5 | |
| La Cumbre Junior High School 7-8 | 468 Students | 24.5 miles away | Not Yet Rated | |
| Santa Barbara High School 9-12 | 2,285 Students | 25.9 miles away | Not Yet Rated | |
| Orcutt Junior High School 7-8 | 493 Students | 26.3 miles away | Not Yet Rated | |
| Santa Barbara Junior High School 7-8 | 732 Students | 26.4 miles away | Not Yet Rated | |
Compare This School To Nearby Schools ->
School Community Forum

Join a discussion about Santa Ynez Valley Union High School and talk to others in the community including students, parents, teachers, and administrators.
Popular Discussion Topics
- Admissions and Registration Questions (e.g. Dress Code and Discipline Policy)
- School Calendar and Upcoming Events (e.g. Graduation)
- After School Programs, Extracurricular Activities, and Athletics (e.g. Football)
- News and Announcements (e.g. Yearbook and Class Supply List Details)
- Graduate and Alumni Events (e.g. Organizing Class Reunions)
Navigation
Can't Find What You Are Looking For?
Rankings
Nearby Cities
Sponsored Links
K-12 Articles
Help Your High School Student Create an Impressive Resume
Time has flown. Your teen is in high school and has demonstrated an interest in obtaining a part...
Those Pesky Little Transitions
Transitions are rarely easy, yet we have to encounter them every day of our lives. For school-aged...
Hurt: A Book Report
My last book report was over 15 years ago, and I'm a bit rusty, but here goes (Don't forget: book...


