Hill Creek Elementary School
Rating
Not Available
Not Available

No Reviews Yet
Find Old Friends From Hill Creek Elementary School
Use the form below to search for alumni from Hill Creek Elementary School.
School Description
School Summary and Highlights
- Enrolls 774 elementary school students from grades KG-8
- Ranks 719th out of 2,050 middle schools in CA.
- 2010 Overall School AYP Met Status: No
Additional Contact Information
- Mailing Address: 9665 Jeremy St., Santee, CA 92071
School District Details
- Santee Elementary School District
- Per-Pupil Spending: $8,581
- Students Per Teacher: 21.0
- Enrolled Students: 6,269
Faculty Details and Student Enrollment
Students and Faculty
- Total Students Enrolled: 774
- Total Full Time "Equivalent" Teachers: 38.0
- Average Student-To-Teacher Ratio: 20.4
Students Gender Breakdown
- Males: 405 (52.3%)
- Females: 369 (47.7%)
Free Lunch Student Eligibility Breakdown
- Eligible for Reduced Lunch: 75 (9.7%)
- Eligible for Free Lunch: 164 (21.2%)
- Eligible for Either Reduced or Free Lunch: 239 (30.9%)
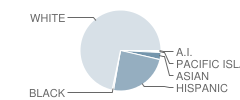
Student Enrollment Distribution by Race / Ethnicity
| Number | Percent | |
|---|---|---|
| American Indian | 4 | 0.5% |
| Black | 5 | 0.6% |
| Asian | 21 | 2.7% |
| Hispanic | 170 | 22.0% |
| White | 502 | 64.9% |
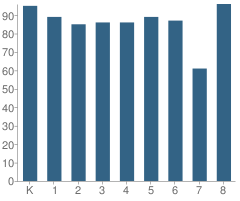
Number of Students Per Grade
| Number | Percent | |
|---|---|---|
| Kindergarten | 95 | 12.3% |
| 1st Grade | 89 | 11.5% |
| 2nd Grade | 85 | 11.0% |
| 3rd Grade | 86 | 11.1% |
| 4th Grade | 86 | 11.1% |
| 5th Grade | 89 | 11.5% |
| 6th Grade | 87 | 11.2% |
| 7th Grade | 61 | 7.9% |
| 8th Grade | 96 | 12.4% |
Teacher Education Background (2009)
Percent With Master's Degree
School:
53.3%
District:
28.6%
Percent With Bachelor's Degree
School:
8.9%
District:
23.8%
Teacher Credentials & Experience (2009)
Percent of Teachers With Credentials: 100.0%
Number of Certificated Staff: 45.0
Average Number of Years of Teacher Experience: 16.7
Average Age
School:
46.0
District:
45.2
Source: CA Department of Education, Source: NCES 2009-2010
School Ratings and Reviews
Be The First To Review Hill Creek Elementary School!
School Map and Similar Schools Nearby
Click to Activate Map of Nearby School Campuses
Private
Public
This School
Similar Schools Nearby
| Cajon Park Elementary School KG-8 | 995 Students | 1.0 miles away |  5 out of 5 | |
| Rio Seco Elementary School KG-8 | 902 Students | 1.2 miles away |  1 out of 5 | |
| Lakeside Farms Elementary School KG-5 | 498 Students | 1.8 miles away |  4.5 out of 5 | |
| Riverview Elementary School KG-5 | 474 Students | 1.9 miles away | Not Yet Rated | |
| Pepper Drive Elementary School KG-8 | 730 Students | 1.9 miles away | Not Yet Rated | |
| Carlton Hills Elementary School KG-8 | 541 Students | 2.0 miles away | Not Yet Rated | |
| Prospect Avenue Elementary School KG-8 | 512 Students | 2.3 miles away | 5 out of 5 | |
| Winter Gardens Elementary School KG-5 | 153 Students | 2.4 miles away |  4 out of 5 | |
| Lemon Crest Elementary School KG-5 | 530 Students | 2.4 miles away | 5 out of 5 | |
| Sycamore Canyon Elementary School KG-6 | 332 Students | 2.5 miles away | Not Yet Rated | |
Compare This School To Nearby Schools ->
School Community Forum

Join a discussion about Hill Creek Elementary School and talk to others in the community including students, parents, teachers, and administrators.
Popular Discussion Topics
- Admissions and Registration Questions (e.g. Dress Code and Discipline Policy)
- School Calendar and Upcoming Events (e.g. Graduation)
- After School Programs, Extracurricular Activities, and Athletics (e.g. Football)
- News and Announcements (e.g. Yearbook and Class Supply List Details)
- Graduate and Alumni Events (e.g. Organizing Class Reunions)
Navigation
Can't Find What You Are Looking For?
Rankings
Nearby Cities
Sponsored Links
K-12 Articles

Help Your Child Achieve Success in Middle School
Middle school is for children between the ages of 10 and 14 years. At this time children begin to...
Middle school is for children between the ages of 10 and 14 years. At this time children begin to...

Teacher Tenure: A Double-Edged Sword
Teacher Tenure (the policy making it almost impossible to fire teachers) has noble roots. It was...
Teacher Tenure (the policy making it almost impossible to fire teachers) has noble roots. It was...

Bullycide: What is It and How Can It Be Prevented?
Disclaimer: This article expresses my opinion that has been formed by personal experience and...
Disclaimer: This article expresses my opinion that has been formed by personal experience and...