Menlo-Atherton High School

No Reviews Yet
Find Old Friends From Menlo-Atherton High School
Use the form below to search for alumni from Menlo-Atherton High School.
School Description
School Summary and Highlights
- Enrolls 1,945 high school students from grades 9-12
- Ranks 394th out of 1,197 high schools in CA.
- 2010 Overall School AYP Met Status: No
Additional Contact Information
- Mailing Address: 555 Middlefield Rd., Atherton, CA 94025
School District Details
- Sequoia Union High School District
- Per-Pupil Spending: $11,871
- Dropout Rate: 2.3%
- Students Per Teacher: 19.7
- Enrolled Students: 8,459
Faculty Details and Student Enrollment
Students and Faculty
- Total Students Enrolled: 1,945
- Total Full Time "Equivalent" Teachers: 100.4
- Average Student-To-Teacher Ratio: 19.4
Students Gender Breakdown
- Males: 999 (51.4%)
- Females: 946 (48.6%)
Free Lunch Student Eligibility Breakdown
- Eligible for Reduced Lunch: 124 (6.4%)
- Eligible for Free Lunch: 530 (27.2%)
- Eligible for Either Reduced or Free Lunch: 654 (33.6%)
Student Enrollment Distribution by Race / Ethnicity
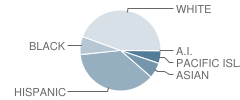
| Number | Percent | |
|---|---|---|
| American Indian | 5 | 0.3% |
| Black | 138 | 7.1% |
| Asian | 120 | 6.2% |
| Hispanic | 702 | 36.1% |
| White | 844 | 43.4% |
Number of Students Per Grade
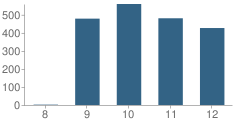
| Number | Percent | |
|---|---|---|
| 8th Grade | 2 | 0.1% |
| 9th Grade | 478 | 24.6% |
| 10th Grade | 559 | 28.7% |
| 11th Grade | 480 | 24.7% |
| 12th Grade | 426 | 21.9% |
Graduates Information (2010)
Graduation Rate
School:
90.5%
District:
90.2%
State:
78.6%
Teacher Education Background (2009)
Percent With Ph.D.
School:
81.3%
District:
21.1%
Percent With Bachelor's Degree: 6.5%
Teacher Credentials & Experience (2009)
Percent of Teachers With Credentials: 95.5%
Number of Certificated Staff: 123.0
Average Number of Years of Teacher Experience: 12.8
Average Age
School:
41.0
District:
52.4
Source: CA Department of Education, Source: NCES 2009-2010
School Ratings and Reviews
Be The First To Review Menlo-Atherton High School!
Sponsored Links
Test Scores and Performance Information
Overall School Rating
How is this determined?
The overall school rating shows that Menlo-Atherton High School performed on average better than many other schools across the state on CST state exams in the following subjects:
- CST Algebra I
- CST Algebra II
- CST Biology
- CST Chemistry
- CST Earth Science
- CST English-Language Arts
- CST General Mathematics
- CST Geometry
- CST Integrated/Coordinated Science
- CST Physics
- CST Science
- CST Summative High School Math
- CST U.S. History
- CST World History
AYP Results (2010)
Overall AYP Met: No
ELA AYP Met: No
Math AYP Met: No
ACT Exam Results (2009)
Percent of Students Taking ACT Exam: 16.0%
Average Combined Score: 25.4
Percent Scoring At or Above 21: 80.3%
SAT Exam Results (2009)
Percent of Students Taking SAT Exam: 58.6%
Average Combined Score: 1,762.6
Critical Reading Average: 580.1
Math Average: 597.4
Writing Average: 585.1
Percent Scoring At or Above 1500: 76.2%
CST - Test Proficiency by Grade and Subject
Grade 9 - % of students at or above proficiency
| School | District | State | |
|---|---|---|---|
| CST Algebra I Test | |||
| 2010 | 29.0% | 29.0% | 22.0% |
| 2009 | 31.0% | 27.0% | 21.0% |
| 2008 | 21.0% | 25.0% | 18.0% |
| CST Algebra II Test | |||
| 2010 | 100.0% | 94.0% | 69.0% |
| 2009 | 100.0% | 92.0% | 65.0% |
| 2008 | 95.0% | 97.0% | 66.0% |
| CST Biology Test | |||
| 2010 | 85.0% | 88.0% | 55.0% |
| 2009 | 89.0% | 82.0% | 51.0% |
| 2008 | 91.0% | 83.0% | 52.0% |
| CST Earth Science Test | |||
| 2010 | 4.0% | 3.0% | 35.0% |
| 2009 | - | - | - |
| 2008 | 6.0% | 4.0% | 31.0% |
| CST English-Language Arts Test | |||
| 2010 | 69.0% | 65.0% | 54.0% |
| 2009 | 58.0% | 57.0% | 50.0% |
| 2008 | 59.0% | 60.0% | 49.0% |
| CST General Mathematics Test | |||
| 2010 | 4.0% | 5.0% | 17.0% |
| CST Geometry Test | |||
| 2010 | 82.0% | 74.0% | 46.0% |
| 2009 | 84.0% | 75.0% | 47.0% |
| 2008 | 85.0% | 70.0% | 43.0% |
| CST Integrated/Coordinated Science Test | |||
| 2010 | 4.0% | 11.0% | 19.0% |
| 2009 | 9.0% | 7.0% | 15.0% |
| 2008 | 7.0% | 11.0% | 5.0% |
Grade 10 - % of students at or above proficiency
| School | District | State | |
|---|---|---|---|
| CST Algebra I Test | |||
| 2010 | 5.0% | 14.0% | 12.0% |
| 2009 | 6.0% | 18.0% | 11.0% |
| 2008 | 7.0% | 11.0% | 9.0% |
| CST Algebra II Test | |||
| 2010 | 64.0% | 63.0% | 40.0% |
| 2009 | 64.0% | 61.0% | 37.0% |
| 2008 | 55.0% | 59.0% | 36.0% |
| CST Biology Test | |||
| 2010 | 25.0% | 35.0% | 38.0% |
| 2009 | 22.0% | 35.0% | 34.0% |
| 2008 | 26.0% | 34.0% | 35.0% |
| CST Chemistry Test | |||
| 2010 | 80.0% | 74.0% | 47.0% |
| 2009 | 77.0% | 67.0% | 44.0% |
| 2008 | 69.0% | 59.0% | 41.0% |
| CST Earth Science Test | |||
| 2010 | 11.0% | 11.0% | 29.0% |
| 2009 | 2.0% | 4.0% | 23.0% |
| 2008 | 6.0% | 6.0% | 23.0% |
| CST English-Language Arts Test | |||
| 2010 | 52.0% | 54.0% | 45.0% |
| 2009 | 53.0% | 54.0% | 44.0% |
| 2008 | 51.0% | 52.0% | 41.0% |
| CST Geometry Test | |||
| 2010 | 20.0% | 21.0% | 14.0% |
| 2009 | 19.0% | 22.0% | 14.0% |
| 2008 | 17.0% | 18.0% | 12.0% |
| CST Science Test | |||
| 2010 | 51.0% | 56.0% | 46.0% |
| 2009 | 51.0% | 56.0% | 44.0% |
| 2008 | 48.0% | 49.0% | 40.0% |
| CST Summative High School Math Test | |||
| 2010 | 100.0% | 95.0% | 75.0% |
| 2009 | 91.0% | 95.0% | 71.0% |
| 2008 | 100.0% | 94.0% | 68.0% |
| CST World History Test | |||
| 2010 | 55.0% | 56.0% | 42.0% |
| 2009 | 53.0% | 53.0% | 38.0% |
| 2008 | 42.0% | 44.0% | 33.0% |
Grade 11 - % of students at or above proficiency
| School | District | State | |
|---|---|---|---|
| CST Algebra I Test | |||
| 2010 | 14.0% | 10.0% | 8.0% |
| 2009 | 25.0% | 13.0% | 8.0% |
| CST Algebra II Test | |||
| 2010 | 10.0% | 15.0% | 14.0% |
| 2009 | 8.0% | 12.0% | 12.0% |
| 2008 | 3.0% | 12.0% | 11.0% |
| CST Biology Test | |||
| 2010 | 62.0% | 46.0% | 46.0% |
| 2009 | 64.0% | 48.0% | 41.0% |
| 2008 | 61.0% | 43.0% | 39.0% |
| CST Chemistry Test | |||
| 2010 | 12.0% | 28.0% | 30.0% |
| 2009 | 14.0% | 28.0% | 27.0% |
| 2008 | 10.0% | 20.0% | 25.0% |
| CST Earth Science Test | |||
| 2010 | 17.0% | 54.0% | 32.0% |
| CST English-Language Arts Test | |||
| 2010 | 56.0% | 51.0% | 42.0% |
| 2009 | 53.0% | 48.0% | 40.0% |
| 2008 | 51.0% | 43.0% | 37.0% |
| CST Geometry Test | |||
| 2010 | 5.0% | 10.0% | 6.0% |
| 2009 | 5.0% | 7.0% | 7.0% |
| 2008 | 8.0% | 6.0% | 6.0% |
| CST Physics Test | |||
| 2010 | 80.0% | 61.0% | 53.0% |
| 2009 | 65.0% | 53.0% | 50.0% |
| 2008 | 72.0% | 49.0% | 47.0% |
| CST Summative High School Math Test | |||
| 2010 | 86.0% | 72.0% | 50.0% |
| 2009 | 69.0% | 64.0% | 47.0% |
| 2008 | 69.0% | 57.0% | 43.0% |
| CST U.S. History Test | |||
| 2010 | 54.0% | 51.0% | 45.0% |
| 2009 | 55.0% | 52.0% | 44.0% |
| 2008 | 45.0% | 42.0% | 38.0% |
End of Course - % of students at or above proficiency
| School | District | State | |
|---|---|---|---|
| CST Algebra I Test | |||
| 2010 | 19.0% | 22.0% | 31.0% |
| 2009 | 26.0% | 23.0% | 28.0% |
| 2008 | 16.0% | 20.0% | 25.0% |
| CST Algebra II Test | |||
| 2010 | 49.0% | 46.0% | 31.0% |
| 2009 | 46.0% | 43.0% | 28.0% |
| 2008 | 36.0% | 39.0% | 27.0% |
| CST Biology Test | |||
| 2010 | 58.0% | 56.0% | 46.0% |
| 2009 | 59.0% | 53.0% | 42.0% |
| 2008 | 59.0% | 53.0% | 42.0% |
| CST Chemistry Test | |||
| 2010 | 54.0% | 53.0% | 38.0% |
| 2009 | 54.0% | 51.0% | 36.0% |
| 2008 | 44.0% | 42.0% | 32.0% |
| CST Earth Science Test | |||
| 2010 | 9.0% | 30.0% | 33.0% |
| 2009 | 2.0% | 17.0% | 28.0% |
| 2008 | 5.0% | 22.0% | 28.0% |
| CST General Mathematics Test | |||
| 2010 | 4.0% | 5.0% | 27.0% |
| CST Geometry Test | |||
| 2010 | 44.0% | 41.0% | 27.0% |
| 2009 | 47.0% | 39.0% | 26.0% |
| 2008 | 48.0% | 35.0% | 24.0% |
| CST Integrated/Coordinated Science Test | |||
| 2010 | 4.0% | 11.0% | 16.0% |
| 2009 | 8.0% | 6.0% | 13.0% |
| 2008 | 6.0% | 10.0% | 11.0% |
| CST Physics Test | |||
| 2010 | 80.0% | 59.0% | 49.0% |
| 2009 | 64.0% | 57.0% | 46.0% |
| 2008 | 72.0% | 51.0% | 43.0% |
| CST Summative High School Math Test | |||
| 2010 | 88.0% | 77.0% | 54.0% |
| 2009 | 72.0% | 69.0% | 50.0% |
| 2008 | 73.0% | 62.0% | 47.0% |
| CST World History Test | |||
| 2010 | 55.0% | 56.0% | 41.0% |
| 2009 | 52.0% | 53.0% | 38.0% |
| 2008 | 40.0% | 42.0% | 33.0% |
Source: CA Department of Education 2009-2010
School Map and Similar Schools Nearby
Click to Activate Map of Nearby School Campuses
Private
Public
This School
Similar Schools Nearby
| Palo Alto High School 9-12 | 1,850 Students | 1.7 miles away | Not Yet Rated | |
| Woodside High School 9-12 | 1,835 Students | 3.4 miles away | Not Yet Rated | |
| Sequoia High School 9-12 | 1,818 Students | 4.0 miles away | Not Yet Rated | |
| Henry M. Gunn High School 9-12 | 1,912 Students | 4.4 miles away | Not Yet Rated | |
| Los Altos High School 9-12 | 1,663 Students | 6.1 miles away | Not Yet Rated | |
| Carlmont High School 9-12 | 2,111 Students | 7.2 miles away | ![]() 5 out of 5 | |
| Ralston Intermediate School 6-9 | 883 Students | 8.4 miles away | Not Yet Rated | |
| Mountain View High School 9-12 | 1,827 Students | 9.0 miles away | Not Yet Rated | |
| Hillsdale High School 9-12 | 1,273 Students | 9.3 miles away | Not Yet Rated | |
| Newark Junior High School 7-8 | 998 Students | 9.5 miles away | ![]() 5 out of 5 | |
Compare This School To Nearby Schools ->
School Community Forum

Join a discussion about Menlo-Atherton High School and talk to others in the community including students, parents, teachers, and administrators.
Popular Discussion Topics
- Admissions and Registration Questions (e.g. Dress Code and Discipline Policy)
- School Calendar and Upcoming Events (e.g. Graduation)
- After School Programs, Extracurricular Activities, and Athletics (e.g. Football)
- News and Announcements (e.g. Yearbook and Class Supply List Details)
- Graduate and Alumni Events (e.g. Organizing Class Reunions)
Navigation
Can't Find What You Are Looking For?
Rankings
Nearby Cities
Sponsored Links
K-12 Articles
The Most Used Form of Communication
Writing has, quite surprisingly, become more and more important in today's electronic society....
Everyone Loves Going to the Doctor and Dentist
Going to the doctor or dentist can be traumatic for children of all ages. Many adults do not...
Keep Morning Stress at a Minimum: Establish a Routine
Morning! It can be a time of stress. The kids are fighting over who gets to use the bathroom first,...

